
AMAZON.COM INC (NASDAQ:AMZN): a strong growth stock preparing for the next leg up?.
By Mill Chart
Last update: Mar 21, 2025
Groth investors are looking for stocks showing high revenue and EPS growth. We will have a look here to see if AMAZON.COM INC (NASDAQ:AMZN) is suited for growth investing, while it is forming a base and may be ready to breakout. Investors should of course do their own research, but we spotted AMAZON.COM INC showing up in our growth with base formation screen, so it may be worth spending some more time on it.
A Closer Look at Growth for AMZN
To evaluate a stock's growth potential, ChartMill utilizes a Growth Rating on a scale of 0 to 10. This comprehensive assessment considers various growth aspects, including historical and estimated EPS and revenue growth. AMZN has achieved a 8 out of 10:
- The Earnings Per Share has grown by an impressive 90.69% over the past year.
- The Earnings Per Share has been growing by 36.89% on average over the past years. This is a very strong growth
- AMZN shows quite a strong growth in Revenue. In the last year, the Revenue has grown by 10.99%.
- AMZN shows quite a strong growth in Revenue. Measured over the last years, the Revenue has been growing by 17.86% yearly.
- The Earnings Per Share is expected to grow by 21.03% on average over the next years. This is a very strong growth
- The Revenue is expected to grow by 10.06% on average over the next years. This is quite good.
Unpacking AMZN's Health Rating
ChartMill employs its own Health Rating for stock assessment. This rating, ranging from 0 to 10, is calculated by examining various liquidity and solvency ratios. In the case of AMZN, the assigned 6 reflects its health status:
- An Altman-Z score of 5.45 indicates that AMZN is not in any danger for bankruptcy at the moment.
- With an excellent Altman-Z score value of 5.45, AMZN belongs to the best of the industry, outperforming 84.38% of the companies in the same industry.
- AMZN has a debt to FCF ratio of 2.31. This is a good value and a sign of high solvency as AMZN would need 2.31 years to pay back of all of its debts.
- The Debt to FCF ratio of AMZN (2.31) is better than 71.88% of its industry peers.
- AMZN has a Debt/Equity ratio of 0.24. This is a healthy value indicating a solid balance between debt and equity.
- The current and quick ratio evaluation for AMZN is rather negative, while it does have excellent solvency and profitability. These ratios do not necessarly indicate liquidity issues and need to be evaluated against the specifics of the business.
Profitability Assessment of AMZN
ChartMill assigns a Profitability Rating to every stock. This score ranges from 0 to 10 and evaluates the different profitability ratios and margins, both absolutely, but also relative to the industry peers. AMZN scores a 8 out of 10:
- AMZN's Return On Assets of 9.48% is amongst the best of the industry. AMZN outperforms 81.25% of its industry peers.
- AMZN's Return On Equity of 20.72% is fine compared to the rest of the industry. AMZN outperforms 75.00% of its industry peers.
- AMZN's Return On Invested Capital of 12.89% is fine compared to the rest of the industry. AMZN outperforms 75.00% of its industry peers.
- The last Return On Invested Capital (12.89%) for AMZN is above the 3 year average (8.32%), which is a sign of increasing profitability.
- The Profit Margin of AMZN (9.29%) is better than 84.38% of its industry peers.
- In the last couple of years the Profit Margin of AMZN has grown nicely.
- With a decent Operating Margin value of 10.75%, AMZN is doing good in the industry, outperforming 75.00% of the companies in the same industry.
- In the last couple of years the Operating Margin of AMZN has grown nicely.
- AMZN's Gross Margin of 48.85% is fine compared to the rest of the industry. AMZN outperforms 68.75% of its industry peers.
- AMZN's Gross Margin has improved in the last couple of years.
Why is AMZN a setup?
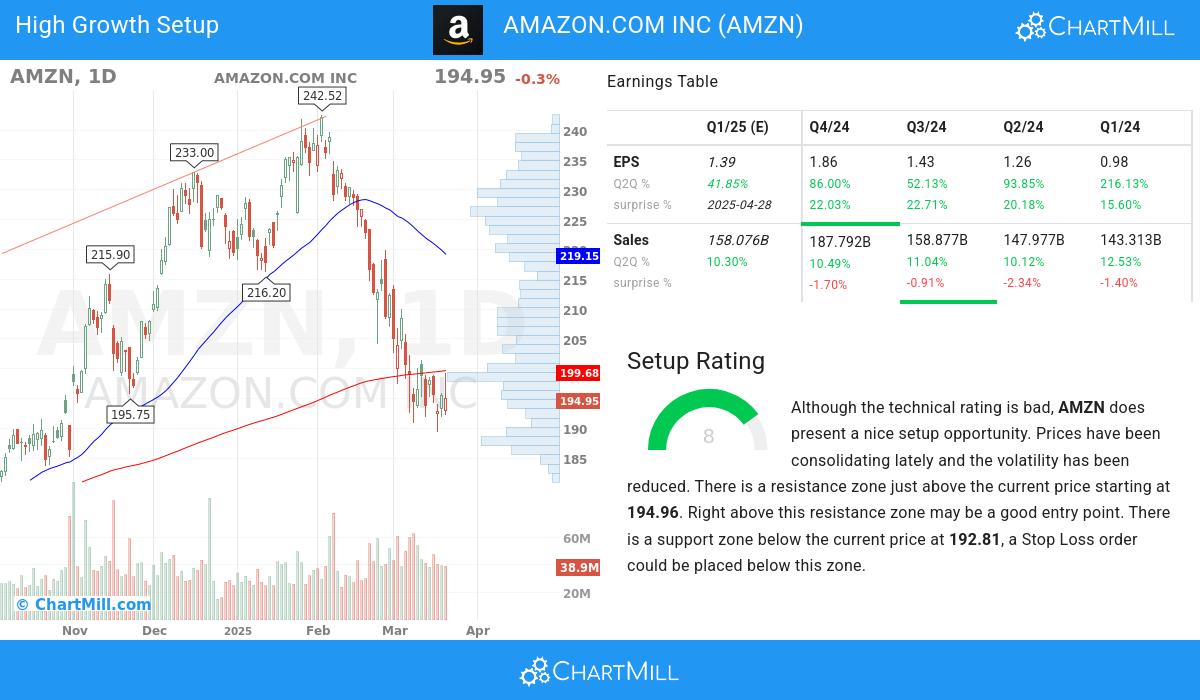
ChartMill also assign a Setup Rating to every stock. This setup score also ranges from 0 to 10 and determines to which extend the stock is consolidating. This is achieved by evaluating multiple short term technical indicators. AMZN currently has a 8 as setup rating:
AMZN has a bad technical rating, but it does show a decent setup pattern. We see reduced volatility while prices have been consolidating in the most recent period. There is a resistance zone just above the current price starting at 194.96. Right above this resistance zone may be a good entry point. There is a support zone below the current price at 192.81, a Stop Loss order could be placed below this zone.
Our Strong Growth screener lists more Strong Growth stocks and is updated daily.
Check the latest full fundamental report of AMZN for a complete fundamental analysis.
For an up to date full technical analysis you can check the technical report of AMZN
Disclaimer
This article should in no way be interpreted as advice. The article is based on the observed metrics at the time of writing, but you should always make your own analysis and trade or invest at your own responsibility.
179.59
-2.53 (-1.39%)
Find more stocks in the Stock Screener
AMZN Latest News and Analysis
 18 hours ago - ChartmillMost active S&P500 stocks in Tuesday's session
Stay informed about the most active S&P500 stocks in today's session as we take a closer look at what's happening on the US markets on Tuesday. Discover the stocks that are generating the highest trading volume and driving market activity.
 2 days ago - ChartmillExplore the top gainers and losers within the S&P500 index in today's session.
Let's have a look at the top S&P500 gainers and losers one hour before the close of the markets of today's session.
2 days ago - ChartmillWhat's going on in today's session: S&P500 most active stocksExplore the S&P500 index on Monday and find out which stocks are the most active in today's session. Stay updated with the stocks that are capturing market interest.
2 days ago - ChartmillExplore the top gainers and losers within the S&P500 index in today's session.Stay informed about the performance of the S&P500 index in the middle of the day on Monday. Uncover the top gainers and losers in today's session for valuable insights.
5 days ago - ChartmillWhich S&P500 stocks are the most active on Friday?Looking for the most active stocks in the S&P500 index on Friday? Dive into today's session and discover the stocks that are dominating the trading activity and setting the pace for the market.
6 days ago - ChartmillWhat's going on in today's session: S&P500 most active stocksLet's have a look at what is happening on the US markets on Thursday. Below you can find the most active S&P500 stocks in today's session.
7 days ago - ChartmillMost active S&P500 stocks in Wednesday's sessionStay informed about the most active stocks in the S&P500 index on Wednesday's session. Discover the stocks that are generating the highest trading volume and driving market activity.
8 days ago - ChartmillMost active S&P500 stocks in Tuesday's sessionExplore the S&P500 index on Tuesday and find out which stocks are the most active in today's session. Stay updated with the stocks that are capturing market interest and driving market movements.
9 days ago - ChartmillStay informed about the most active stocks in the S&P500 index on Monday's session.Looking for the most active stocks in the S&P500 index on Monday? Dive into today's session and discover the stocks that are dominating the trading activity and setting the pace for the market.
 9 days ago - ChartmillThese S&P500 stocks have an unusual volume in today's session
Let's take a closer look at the S&P500 stocks with an unusual volume in today's session on Monday. Stay informed about the market activity below.
12 days ago - ChartmillWhat's going on in today's session: S&P500 most active stocksLooking for the most active S&P500 stocks in today's session? Join us as we dive into the US markets on Friday and discover the stocks that are dominating the trading activity and setting the pace for the market.
12 days ago - ChartmillDiscover the most active stocks in Friday's session.Let's have a look at what is happening on the US markets on Friday. Below you can find the most active stocks in today's session.
