Interesting Technical Analysis finding for AMERICAN TOWER CORP (NYSE:AMT)
By Mill Chart
Last update: Apr 19, 2025
A possible breakout setup was detected on AMERICAN TOWER CORP (NYSE:AMT) by our stockscreener. A breakout pattern is formed when a stock consolidates after a strong rise up. We note that this pattern is detected purely based on technical analysis and whether the breakout actually materializes remains to be seen. It could be interesting to keep an eye on NYSE:AMT.
Technical Analysis Observations
Every day, ChartMill assigns a Technical Rating to each stock, providing a score ranging from 0 to 10. This rating is determined by evaluating various technical indicators and properties.
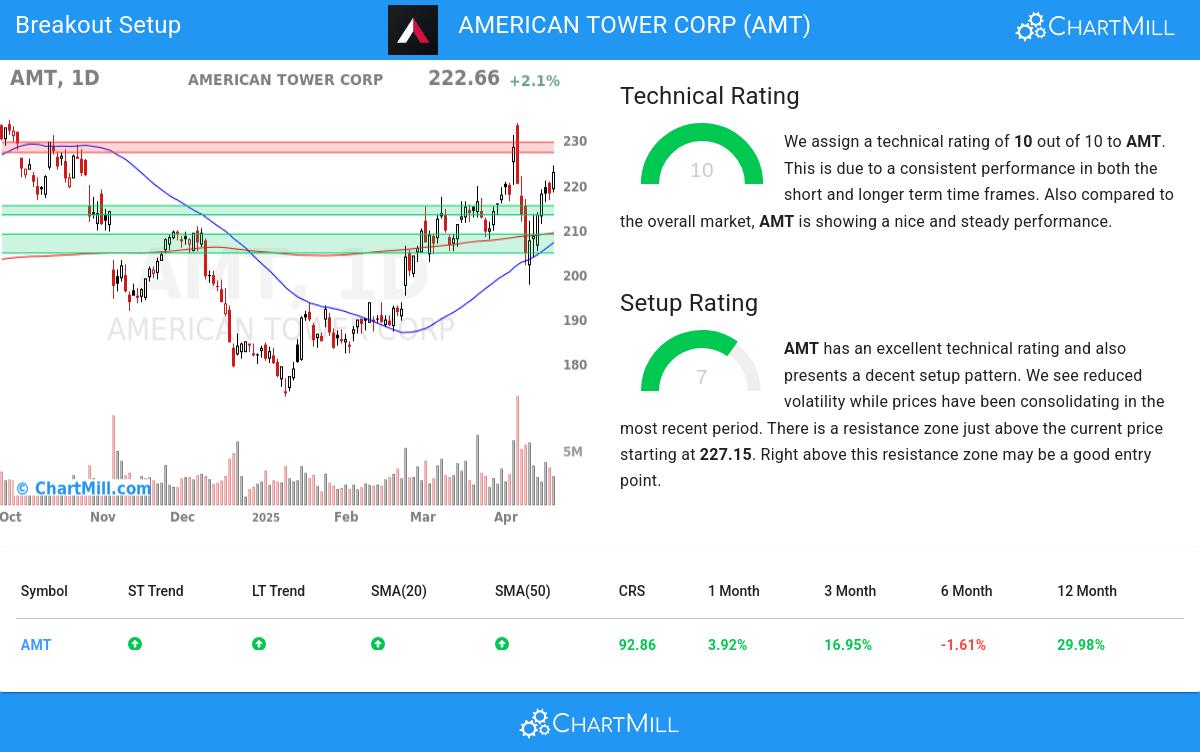
Taking everything into account, AMT scores 10 out of 10 in our technical rating. This is due to a consistent performance in both the short and longer term time frames. Also compared to the overall market, AMT is showing a nice and steady performance.
- The long and short term trends are both positive. This is looking good!
- Looking at the yearly performance, AMT did better than 92% of all other stocks.
- AMT is part of the Specialized REITs industry. There are 30 other stocks in this industry. AMT outperforms 93% of them.
- AMT is currently trading in the middle of its 52 week range. This is in line with the S&P500 Index, which is also trading in the middle of its range.
- In the last month AMT has a been trading in the 197.50 - 233.80 range, which is quite wide. It is currently trading in the middle of this range, so some resistance may be found above.
For an up to date full technical analysis you can check the technical report of AMT
Looking at the Setup
In addition to the Technical Rating, ChartMill provides a Setup Rating for each stock. This rating, ranging from 0 to 10, assesses the extent of consolidation in the stock based on multiple short-term technical indicators. Currently, AMT has a 7 as its setup rating:
Besides having an excellent technical rating, AMT also presents a decent setup pattern. We see reduced volatility while prices have been consolidating in the most recent period. There is a resistance zone just above the current price starting at 227.15. Right above this resistance zone may be a good entry point.
How to trade AMT?
One strategy to consider is waiting for the actual breakout to occur, where the stock breaks out above the current consolidation zone. Traders can then enter a buy position, anticipating further upward momentum. As a risk management measure, it is advisable to set a stop loss order below the consolidation zone.
This article should in no way be interpreted as trading advice. You should always make your own analysis and trade or not trade based on your own observations and style. The article is based purely on some technical observations.
More breakout setups can be found in our Breakout screener.
Disclaimer
This is not investing advice! The article highlights some of the observations at the time of writing, but you should always make your own analysis and invest based on your own insights.
222.66
+4.66 (+2.14%)
Find more stocks in the Stock Screener
AMT Latest News and Analysis
 5 minutes ago - ChartmillInteresting Technical Analysis finding for AMERICAN TOWER CORP (NYSE:AMT)
AMERICAN TOWER CORP (NYSE:AMT) has a good technical rating of 10 out of 10 and could possibly break out.
 11 days ago - ChartmillWhich S&P500 stocks are gapping on Tuesday?
Curious about the market action on Tuesday? Dive into the US markets to explore the gap up and gap down stocks in the S&P500 index during today's session.
 16 days ago - ChartmillUncover the latest developments among S&P500 stocks in today's session.
Stay updated with the movement of S&P500 stocks in today's session. Discover which S&P500 stocks are making waves on Thursday.
16 days ago - ChartmillThursday's session: top gainers and losers in the S&P500 indexStay informed about the performance of the S&P500 index in the middle of the day on Thursday. Uncover the top gainers and losers in today's session for valuable insights.
