NASDAQ:AMPH is an undervalued gem with solid fundamentals.
By Mill Chart
Last update: Feb 18, 2025
AMPHASTAR PHARMACEUTICALS IN (NASDAQ:AMPH) was identified as a decent value stock by our stock screener. NASDAQ:AMPH scores well on profitability, solvency and liquidity. At the same time it seems to be priced very reasonably. We'll explore this a bit deeper below.
Valuation Insights: NASDAQ:AMPH
An integral part of ChartMill's stock analysis is the Valuation Rating, which spans from 0 to 10. This rating evaluates diverse valuation factors, including price to earnings and cash flows, while considering the stock's profitability and growth. NASDAQ:AMPH has received a 9 out of 10:
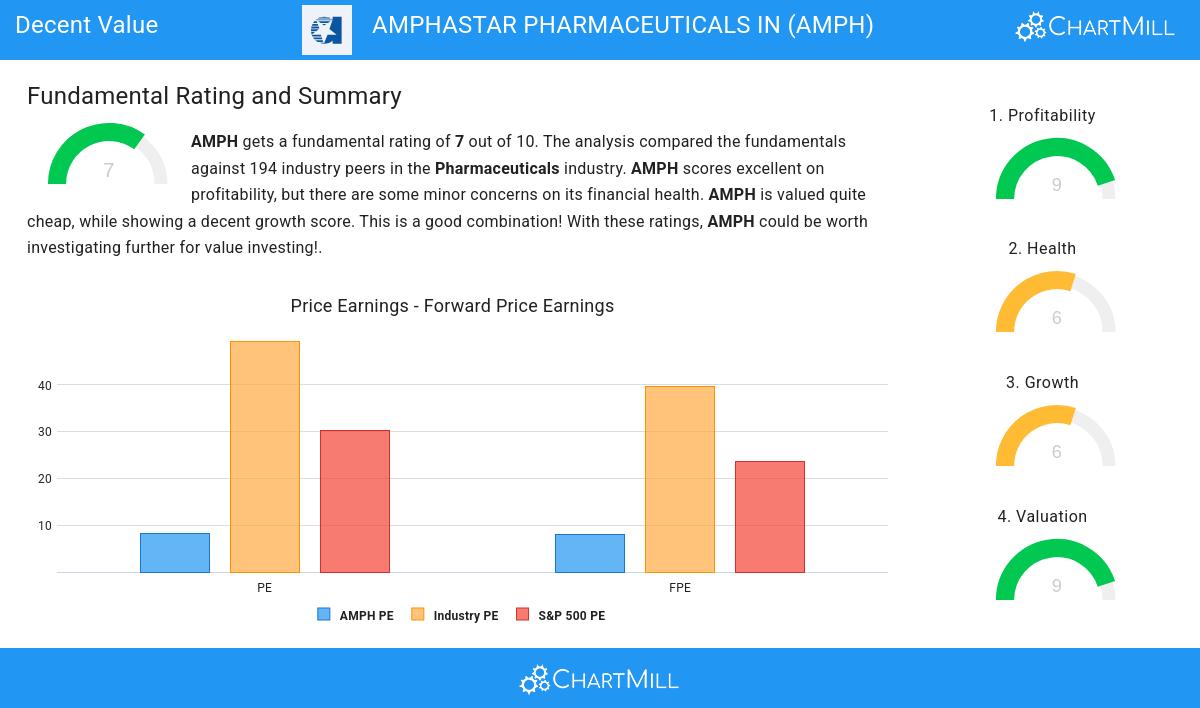
- Based on the Price/Earnings ratio of 8.12, the valuation of AMPH can be described as reasonable.
- AMPH's Price/Earnings ratio is rather cheap when compared to the industry. AMPH is cheaper than 94.05% of the companies in the same industry.
- When comparing the Price/Earnings ratio of AMPH to the average of the S&P500 Index (30.19), we can say AMPH is valued rather cheaply.
- A Price/Forward Earnings ratio of 8.02 indicates a reasonable valuation of AMPH.
- 91.35% of the companies in the same industry are more expensive than AMPH, based on the Price/Forward Earnings ratio.
- The average S&P500 Price/Forward Earnings ratio is at 23.58. AMPH is valued rather cheaply when compared to this.
- 93.51% of the companies in the same industry are more expensive than AMPH, based on the Enterprise Value to EBITDA ratio.
- 91.89% of the companies in the same industry are more expensive than AMPH, based on the Price/Free Cash Flow ratio.
- The low PEG Ratio(NY), which compensates the Price/Earnings for growth, indicates a rather cheap valuation of the company.
- AMPH has an outstanding profitability rating, which may justify a higher PE ratio.
A Closer Look at Profitability for NASDAQ:AMPH
ChartMill assigns a Profitability Rating to every stock. This score ranges from 0 to 10 and evaluates the different profitability ratios and margins, both absolutely, but also relative to the industry peers. NASDAQ:AMPH scores a 9 out of 10:
- AMPH has a Return On Assets of 10.21%. This is amongst the best in the industry. AMPH outperforms 93.51% of its industry peers.
- The Return On Equity of AMPH (21.67%) is better than 94.59% of its industry peers.
- AMPH has a better Return On Invested Capital (12.46%) than 90.27% of its industry peers.
- The last Return On Invested Capital (12.46%) for AMPH is above the 3 year average (11.94%), which is a sign of increasing profitability.
- Looking at the Profit Margin, with a value of 21.80%, AMPH belongs to the top of the industry, outperforming 94.05% of the companies in the same industry.
- AMPH's Profit Margin has improved in the last couple of years.
- The Operating Margin of AMPH (29.61%) is better than 93.51% of its industry peers.
- In the last couple of years the Operating Margin of AMPH has grown nicely.
- The Gross Margin of AMPH (52.98%) is better than 62.16% of its industry peers.
- In the last couple of years the Gross Margin of AMPH has grown nicely.
Exploring NASDAQ:AMPH's Health
ChartMill employs a unique Health Rating system for all stocks. This rating, ranging from 0 to 10, is determined by analyzing various liquidity and solvency ratios. For NASDAQ:AMPH, the assigned 6 for health provides valuable insights:
- AMPH's Altman-Z score of 2.80 is fine compared to the rest of the industry. AMPH outperforms 72.97% of its industry peers.
- The Debt to FCF ratio of AMPH is 3.51, which is a good value as it means it would take AMPH, 3.51 years of fcf income to pay off all of its debts.
- The Debt to FCF ratio of AMPH (3.51) is better than 89.73% of its industry peers.
- AMPH has a Current Ratio of 3.43. This indicates that AMPH is financially healthy and has no problem in meeting its short term obligations.
- A Quick Ratio of 2.61 indicates that AMPH has no problem at all paying its short term obligations.
Understanding NASDAQ:AMPH's Growth
ChartMill assigns a Growth Rating to each stock, ranging from 0 to 10. This rating is determined by analyzing different growth elements, including EPS and revenue growth, spanning both historical and future figures. In the case of NASDAQ:AMPH, the assigned 6 reflects its growth potential:
- The Earnings Per Share has grown by an impressive 21.27% over the past year.
- The Earnings Per Share has been growing by 70.36% on average over the past years. This is a very strong growth
- Looking at the last year, AMPH shows a very strong growth in Revenue. The Revenue has grown by 20.33%.
- The Revenue has been growing by 16.94% on average over the past years. This is quite good.
- Based on estimates for the next years, AMPH will show a quite strong growth in Revenue. The Revenue will grow by 8.30% on average per year.
More Decent Value stocks can be found in our Decent Value screener.
For an up to date full fundamental analysis you can check the fundamental report of AMPH
Keep in mind
This is not investing advice! The article highlights some of the observations at the time of writing, but you should always make your own analysis and invest based on your own insights.
31.21
+0.46 (+1.5%)
Find more stocks in the Stock Screener
AMPH Latest News and Analysis
 2 days ago - ChartmillNASDAQ:AMPH is an undervalued gem with solid fundamentals.
AMPHASTAR PHARMACEUTICALS IN is a hidden gem, featuring undervaluation and robust fundamentals. NASDAQ:AMPH showcases decent financial health and profitability, coupled with an attractive price.
