Groth investors are looking for stocks showing high revenue and EPS growth. We will have a look here to see if ADVANCED MICRO DEVICES (NASDAQ:AMD) is suited for growth investing, while it is forming a base and may be ready to breakout. Investors should of course do their own research, but we spotted ADVANCED MICRO DEVICES showing up in our growth with base formation screen, so it may be worth spending some more time on it.
Growth Insights: NASDAQ:AMD
ChartMill employs its own Growth Rating system for all stocks. This score, ranging from 0 to 10, is derived by evaluating different growth factors, such as EPS and revenue growth, taking into account both past performance and future projections. NASDAQ:AMD has earned a 8 for growth:
- AMD shows a strong growth in Earnings Per Share. In the last year, the EPS has been growing by 9.45%, which is quite good.
- The Earnings Per Share has been growing by 41.94% on average over the past years. This is a very strong growth
- The Revenue has been growing by 28.49% on average over the past years. This is a very strong growth!
- AMD is expected to show a strong growth in Earnings Per Share. In the coming years, the EPS will grow by 32.66% yearly.
- Based on estimates for the next years, AMD will show a quite strong growth in Revenue. The Revenue will grow by 16.88% on average per year.
Unpacking NASDAQ:AMD's Health Rating
ChartMill assigns a Health Rating to every stock. This score ranges from 0 to 10 and evaluates the different health aspects like liquidity and solvency, both absolutely, but also relative to the industry peers. NASDAQ:AMD scores a 7 out of 10:
- AMD has an Altman-Z score of 14.75. This indicates that AMD is financially healthy and has little risk of bankruptcy at the moment.
- AMD's Altman-Z score of 14.75 is amongst the best of the industry. AMD outperforms 86.24% of its industry peers.
- The Debt to FCF ratio of AMD is 1.27, which is an excellent value as it means it would take AMD, only 1.27 years of fcf income to pay off all of its debts.
- AMD has a better Debt to FCF ratio (1.27) than 75.23% of its industry peers.
- A Debt/Equity ratio of 0.03 indicates that AMD is not too dependend on debt financing.
- Looking at the Debt to Equity ratio, with a value of 0.03, AMD is in the better half of the industry, outperforming 61.47% of the companies in the same industry.
- AMD has a Current Ratio of 2.82. This indicates that AMD is financially healthy and has no problem in meeting its short term obligations.
- A Quick Ratio of 2.01 indicates that AMD has no problem at all paying its short term obligations.
Profitability Analysis for NASDAQ:AMD
ChartMill employs its own Profitability Rating system for stock evaluation. This score, ranging from 0 to 10, is derived from an analysis of diverse profitability metrics and margins. In the case of NASDAQ:AMD, the assigned 5 is noteworthy for profitability:
- The last Return On Invested Capital (1.07%) for AMD is well below the 3 year average (12.36%), which needs to be investigated, but indicates that AMD had better years and this may not be a problem.
- AMD has a Gross Margin of 47.61%. This is in the better half of the industry: AMD outperforms 60.55% of its industry peers.
- In the last couple of years the Gross Margin of AMD has grown nicely.
Looking at the Setup
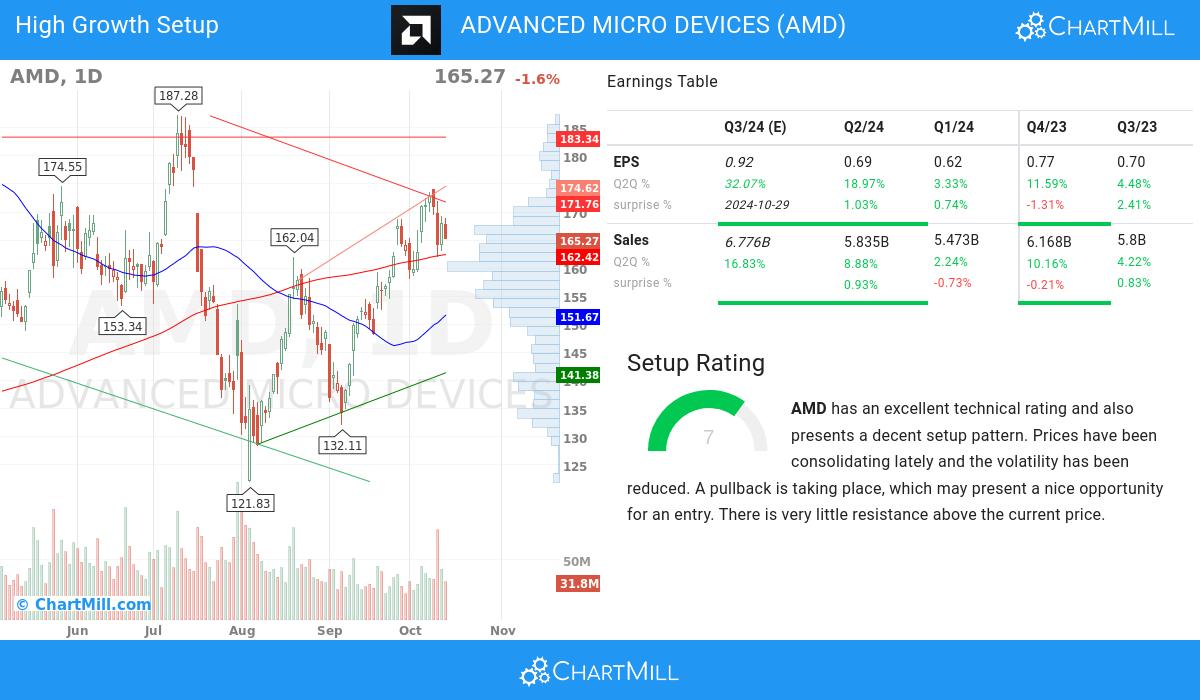
In addition to the Technical Rating, ChartMill provides a Setup Rating for each stock. This rating, ranging from 0 to 10, assesses the level of consolidation in the stock based on multiple short-term technical indicators. Currently, NASDAQ:AMD has a 7 as its setup rating, indicating its current consolidation status.
Besides having an excellent technical rating, AMD also presents a decent setup pattern. We see reduced volatility while prices have been consolidating in the most recent period. A pullback is taking place, which may present a nice opportunity for an entry. There is very little resistance above the current price.
Every day, new Strong Growth stocks can be found on ChartMill in our Strong Growth screener.
Check the latest full fundamental report of AMD for a complete fundamental analysis.
For an up to date full technical analysis you can check the technical report of AMD
Disclaimer
Important Note: The content of this article is not intended as trading advice. It is essential to perform your own analysis and exercise caution when making trading decisions. The article presents observations created by automated analysis but does not guarantee any trading or investment outcomes. Always trade responsibly and make independent judgments.