
NYSE:ALSN appears to be flying under the radar despite its strong fundamentals.
By Mill Chart
Last update: Sep 12, 2024
Uncover the potential of ALLISON TRANSMISSION HOLDING (NYSE:ALSN) as our stock screener's choice for an undervalued stock. NYSE:ALSN maintains a strong financial position and offers an appealing valuation. We'll delve into the specifics below.
Unpacking NYSE:ALSN's Valuation Rating
ChartMill assigns a Valuation Rating to every stock. This score ranges from 0 to 10 and evaluates the different valuation aspects and compares the price to earnings and cash flows, while taking into account profitability and growth. NYSE:ALSN scores a 8 out of 10:
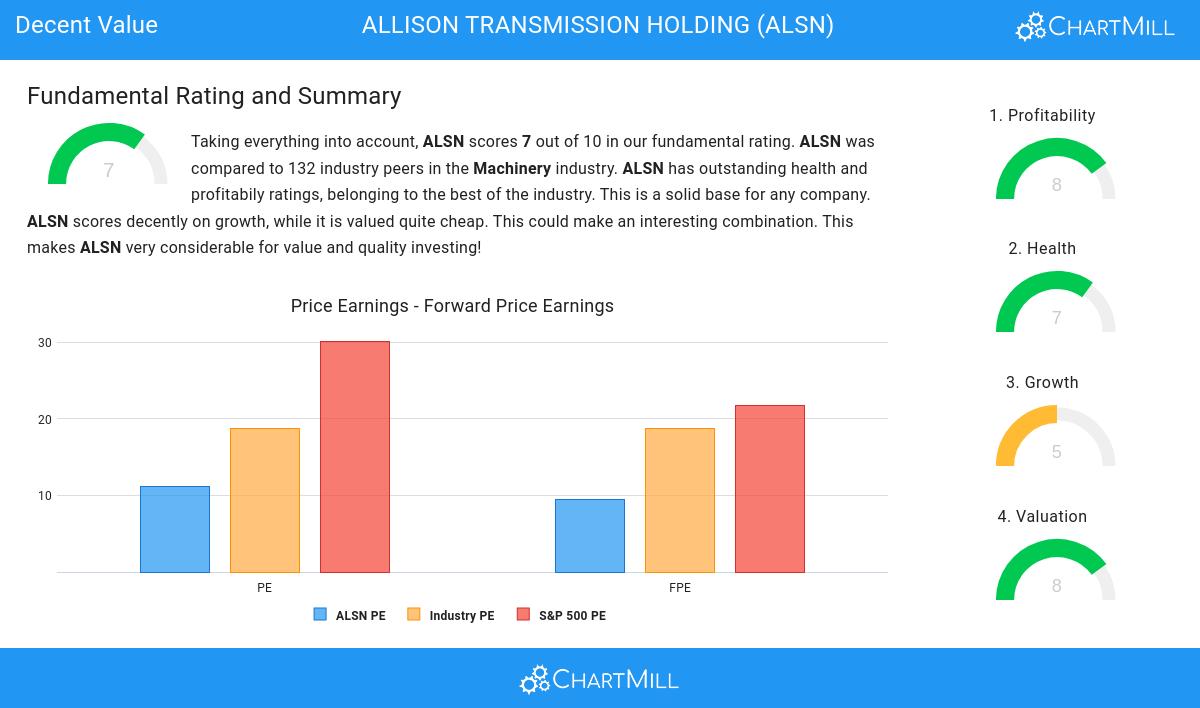
- The Price/Earnings ratio is 11.19, which indicates a very decent valuation of ALSN.
- Based on the Price/Earnings ratio, ALSN is valued cheaper than 86.15% of the companies in the same industry.
- When comparing the Price/Earnings ratio of ALSN to the average of the S&P500 Index (30.15), we can say ALSN is valued rather cheaply.
- The Price/Forward Earnings ratio is 9.46, which indicates a very decent valuation of ALSN.
- Based on the Price/Forward Earnings ratio, ALSN is valued cheaper than 87.69% of the companies in the same industry.
- ALSN is valuated cheaply when we compare the Price/Forward Earnings ratio to 21.77, which is the current average of the S&P500 Index.
- 79.23% of the companies in the same industry are more expensive than ALSN, based on the Enterprise Value to EBITDA ratio.
- Based on the Price/Free Cash Flow ratio, ALSN is valued cheaper than 90.00% of the companies in the same industry.
- ALSN has an outstanding profitability rating, which may justify a higher PE ratio.
- ALSN's earnings are expected to grow with 12.96% in the coming years. This may justify a more expensive valuation.
Evaluating Profitability: NYSE:ALSN
ChartMill assigns a Profitability Rating to every stock. This score ranges from 0 to 10 and evaluates the different profitability ratios and margins, both absolutely, but also relative to the industry peers. NYSE:ALSN scores a 8 out of 10:
- ALSN has a better Return On Assets (13.21%) than 89.23% of its industry peers.
- With an excellent Return On Equity value of 46.09%, ALSN belongs to the best of the industry, outperforming 96.15% of the companies in the same industry.
- ALSN has a Return On Invested Capital of 16.56%. This is amongst the best in the industry. ALSN outperforms 89.23% of its industry peers.
- ALSN had an Average Return On Invested Capital over the past 3 years of 15.20%. This is above the industry average of 11.19%.
- The 3 year average ROIC (15.20%) for ALSN is below the current ROIC(16.56%), indicating increased profibility in the last year.
- ALSN has a Profit Margin of 21.95%. This is amongst the best in the industry. ALSN outperforms 98.46% of its industry peers.
- With an excellent Operating Margin value of 30.30%, ALSN belongs to the best of the industry, outperforming 100.00% of the companies in the same industry.
- Looking at the Gross Margin, with a value of 47.75%, ALSN belongs to the top of the industry, outperforming 90.77% of the companies in the same industry.
How We Gauge Health for NYSE:ALSN
ChartMill assigns a proprietary Health Rating to each stock. The score is computed by evaluating various liquidity and solvency ratios and ranges from 0 to 10. NYSE:ALSN was assigned a score of 7 for health:
- ALSN has a debt to FCF ratio of 3.53. This is a good value and a sign of high solvency as ALSN would need 3.53 years to pay back of all of its debts.
- ALSN's Debt to FCF ratio of 3.53 is fine compared to the rest of the industry. ALSN outperforms 64.62% of its industry peers.
- A Current Ratio of 2.78 indicates that ALSN has no problem at all paying its short term obligations.
- The Current ratio of ALSN (2.78) is better than 71.54% of its industry peers.
- A Quick Ratio of 2.19 indicates that ALSN has no problem at all paying its short term obligations.
- ALSN has a better Quick ratio (2.19) than 77.69% of its industry peers.
Growth Analysis for NYSE:ALSN
To evaluate a stock's growth potential, ChartMill utilizes a Growth Rating on a scale of 0 to 10. This comprehensive assessment considers various growth aspects, including historical and estimated EPS and revenue growth. NYSE:ALSN has achieved a 5 out of 10:
- The Earnings Per Share has grown by an nice 14.24% over the past year.
- Measured over the past years, ALSN shows a quite strong growth in Earnings Per Share. The EPS has been growing by 9.25% on average per year.
- When comparing the Revenue growth rate of the last years to the growth rate of the upcoming years, we see that the growth is accelerating.
Every day, new Decent Value stocks can be found on ChartMill in our Decent Value screener.
For an up to date full fundamental analysis you can check the fundamental report of ALSN
Disclaimer
This is not investing advice! The article highlights some of the observations at the time of writing, but you should always make your own analysis and invest based on your own insights.
NYSE:ALSN (4/16/2025, 1:24:06 PM)
88.21
-0.82 (-0.92%)
Find more stocks in the Stock Screener
