
Discover ALAMOS GOLD INC-CLASS A (NYSE:AGI), an undervalued growth gem identified by our stock screener. NYSE:AGI is shining in terms of growth metrics, and it's also displaying strong financial health and profitability. What's more, it retains an appealing valuation. We'll break it down further.
Deciphering NYSE:AGI's Growth Rating
ChartMill assigns a proprietary Growth Rating to each stock. The score is computed by evaluating various growth aspects, like EPS and revenue growth. We take into account the history as well as the estimated future numbers. NYSE:AGI was assigned a score of 8 for growth:
- The Earnings Per Share has grown by an impressive 46.51% over the past year.
- AGI shows a strong growth in Earnings Per Share. Measured over the last years, the EPS has been growing by 60.35% yearly.
- AGI shows quite a strong growth in Revenue. In the last year, the Revenue has grown by 17.01%.
- AGI shows quite a strong growth in Revenue. Measured over the last years, the Revenue has been growing by 9.44% yearly.
- AGI is expected to show a strong growth in Earnings Per Share. In the coming years, the EPS will grow by 27.38% yearly.
- AGI is expected to show quite a strong growth in Revenue. In the coming years, the Revenue will grow by 13.43% yearly.
- When comparing the Revenue growth rate of the last years to the growth rate of the upcoming years, we see that the growth is accelerating.
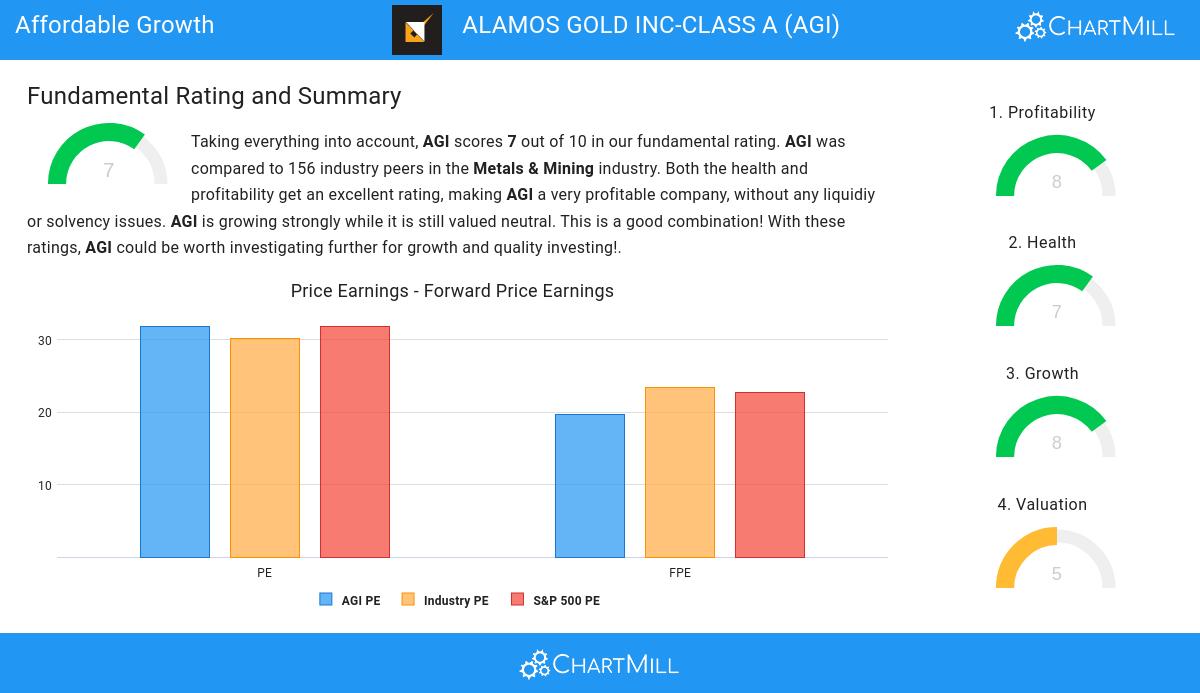
Valuation Analysis for NYSE:AGI
ChartMill employs its own Valuation Rating system for all stocks. This score, ranging from 0 to 10, is determined by evaluating different valuation factors, including price to earnings and free cash flow, both in absolute terms and relative to the market and industry. NYSE:AGI has earned a 5 for valuation:
- AGI's Price/Earnings ratio is a bit cheaper when compared to the industry. AGI is cheaper than 60.26% of the companies in the same industry.
- Based on the Price/Free Cash Flow ratio, AGI is valued a bit cheaper than the industry average as 64.74% of the companies are valued more expensively.
- The low PEG Ratio(NY), which compensates the Price/Earnings for growth, indicates a rather cheap valuation of the company.
- AGI has an outstanding profitability rating, which may justify a higher PE ratio.
- AGI's earnings are expected to grow with 22.09% in the coming years. This may justify a more expensive valuation.
Health Analysis for NYSE:AGI
Every stock is evaluated by ChartMill, receiving a Health Rating on a scale of 0 to 10. This assessment considers different health aspects, including liquidity and solvency, both in absolute terms and relative to industry peers. NYSE:AGI has achieved a 7 out of 10:
- An Altman-Z score of 5.01 indicates that AGI is not in any danger for bankruptcy at the moment.
- AGI's Altman-Z score of 5.01 is fine compared to the rest of the industry. AGI outperforms 70.51% of its industry peers.
- AGI has no outstanding debt. Therefor its Debt/Equity and Debt/FCF ratios are 0 and belong to the best of the industry.
- A Current Ratio of 3.04 indicates that AGI has no problem at all paying its short term obligations.
- The Current ratio of AGI (3.04) is better than 62.18% of its industry peers.
- AGI has a better Quick ratio (1.97) than 60.90% of its industry peers.
What does the Profitability looks like for NYSE:AGI
ChartMill's Profitability Rating offers a unique perspective on stock analysis, providing scores from 0 to 10. These ratings consider a wide range of profitability metrics and margins, both in comparison to industry peers and on their own merits. For NYSE:AGI, the assigned 8 is a significant indicator of profitability:
- AGI has a Return On Assets of 4.77%. This is in the better half of the industry: AGI outperforms 75.64% of its industry peers.
- Looking at the Return On Equity, with a value of 6.49%, AGI is in the better half of the industry, outperforming 68.59% of the companies in the same industry.
- The Return On Invested Capital of AGI (7.50%) is better than 76.28% of its industry peers.
- The last Return On Invested Capital (7.50%) for AGI is above the 3 year average (5.43%), which is a sign of increasing profitability.
- The Profit Margin of AGI (17.73%) is better than 91.67% of its industry peers.
- In the last couple of years the Profit Margin of AGI has grown nicely.
- With an excellent Operating Margin value of 33.43%, AGI belongs to the best of the industry, outperforming 91.67% of the companies in the same industry.
- AGI's Operating Margin has improved in the last couple of years.
- AGI has a better Gross Margin (48.88%) than 89.10% of its industry peers.
- In the last couple of years the Gross Margin of AGI has grown nicely.
Our Affordable Growth screener lists more Affordable Growth stocks and is updated daily.
Check the latest full fundamental report of AGI for a complete fundamental analysis.
Keep in mind
This article should in no way be interpreted as advice. The article is based on the observed metrics at the time of writing, but you should always make your own analysis and trade or invest at your own responsibility.