Exploring NASDAQ:AFRM's high growth characteristics.
By Mill Chart
Last update: Feb 7, 2025
Our stock screener has flagged AFFIRM HOLDINGS INC (NASDAQ:AFRM) as a potential breakout candidate. This occurs when the stock shows signs of consolidation after a notable upward trend. While we can't predict the actual breakout, it's worth monitoring NASDAQ:AFRM for potential movement.
Technical Analysis Observations
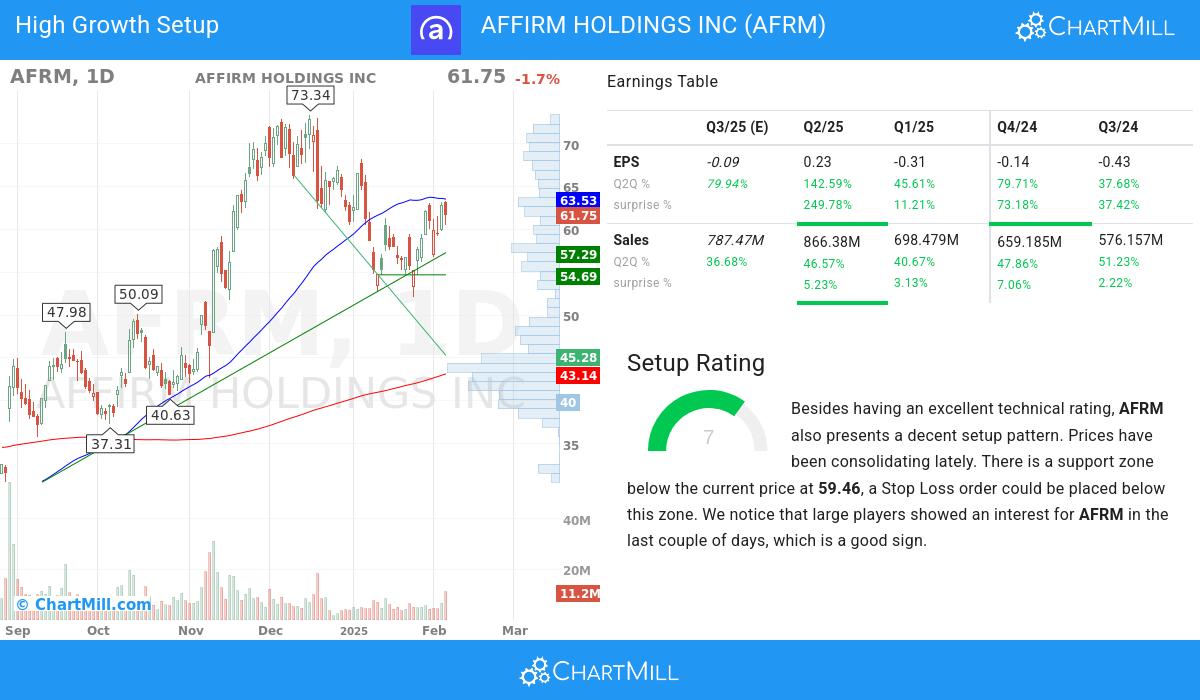
ChartMill assigns a Technical Rating to every stock. This score, ranging from 0 to 10, is updated daily and is determined by evaluating multiple technical indicators and properties.
Taking everything into account, AFRM scores 7 out of 10 in our technical rating. In the last year, AFRM was one of the better performers, but we do observe some doubts in the very recent evolution.
- The long term trend is positive and the short term trend is neutral. The long term trend gets the benefit of the doubt for now.
- AFRM is one of the better performing stocks in the Financial Services industry, it outperforms 90% of 102 stocks in the same industry.
- AFRM is currently trading in the upper part of its 52 week range. The S&P500 Index however is currently trading near a new high, so AFRM is lagging the market slightly.
- In the last month AFRM has a been trading in the 52.13 - 63.36 range, which is quite wide. It is currently trading near the high of this range.
- When comparing the yearly performance of all stocks, we notice that AFRM is one of the better performing stocks in the market, outperforming 90% of all stocks. On top of that, AFRM also shows a nice and consistent pattern of rising prices. However, this overall performance is mostly based on the strong move around 4 months ago.
Check the latest full technical report of AFRM for a complete technical analysis.
How does the Setup look for NASDAQ:AFRM
Besides the Technical Rating, ChartMill assigns a Setup Rating to every stock to determine the degree of consolidation. This rating, ranging from 0 to 10, is updated daily and evaluates various short-term technical indicators. NASDAQ:AFRM currently holds a 7 as its setup rating, suggesting a particular level of consolidation in the stock.
AFRM has an excellent technical rating and also presents a decent setup pattern. Prices have been consolidating lately. There is a support zone below the current price at 59.46, a Stop Loss order could be placed below this zone. We notice that large players showed an interest for AFRM in the last couple of days, which is a good sign.
Some of the high growth metrics of NASDAQ:AFRM highlighted
- The EPS of AFFIRM HOLDINGS INC has exhibited growth from one quarter to another (Q2Q), with a 143.0% increase. This underscores the company's ability to generate higher earnings and improve its financial standing.
- AFFIRM HOLDINGS INC has demonstrated strong quarter-to-quarter (Q2Q) revenue growth of 46.57%, reflecting its ability to generate consistent increases in sales. This growth highlights the company's effective market positioning and its potential for continued success.
- The 1-year revenue growth of AFFIRM HOLDINGS INC (51.89%) has been strong, reflecting the company's ability to generate consistent sales growth. This growth suggests the company's ability to meet customer needs and expand its market share.
- AFFIRM HOLDINGS INC has seen a 59.72% change in the average next Quarter EPS Estimate by analysts over the last 3 months, signaling the shifting perception of the company's EPS outlook.
- The quarterly earnings of AFFIRM HOLDINGS INC have shown a 143.0% increase compared to the previous quarter, as revealed in the recent financial report. This growth signifies positive momentum in the company's financials, pointing towards a promising upward trend
- AFFIRM HOLDINGS INC shows accelerating EPS growth: when comparing the current Q2Q growth of 143.0% to the previous year Q2Q growth of 50.91%, we see the growth rate improving.
- AFFIRM HOLDINGS INC has shown positive growth in its operating margin over the past year, indicating improved operational efficiency. This growth highlights the company's ability to effectively manage costs and maximize profitability.
- With a favorable trend in its free cash flow (FCF) over the past year, AFFIRM HOLDINGS INC demonstrates its ability to generate robust cash flows and maintain financial stability. This growth reflects the company's focus on efficient capital allocation and cash management.
- AFFIRM HOLDINGS INC exhibits a favorable ownership structure, with an institutional shareholder ownership of 80.12%. This signifies a diverse investor base, which can contribute to a more stable and efficient market for the stock.
- With a track record of beating EPS estimates in the last 4 quarters, AFFIRM HOLDINGS INC showcases its consistent ability to deliver earnings surprises. This reflects the company's strong execution and its competitive position in the market.
- AFFIRM HOLDINGS INC has exhibited strong Relative Strength(RS) in recent periods, with a current 90.41 rating. This indicates the stock's ability to outperform the broader market and reflects its competitive position. AFFIRM HOLDINGS INC shows promising potential for continued price momentum.
Our High Growth Momentum Breakout screen will find you more ideas suited for high growth momentum breakouts.
Disclaimer
This is not investing advice! The article highlights some of the observations at the time of writing, but you should always make your own analysis and invest based on your own insights.
AFFIRM HOLDINGS INC
NASDAQ:AFRM (2/6/2025, 8:00:00 PM)
Premarket: 70.1 +8.35 (+13.52%)61.75
-1.05 (-1.67%)
AFRM Latest News and Analysis
 5 hours ago - ChartmillExploring NASDAQ:AFRM's high growth characteristics.
Why the high growth investor may take a look at AFFIRM HOLDINGS INC (NASDAQ:AFRM). A fundamental and technical analysis of (NASDAQ:AFRM).
 16 hours ago - ChartmillThese stocks are moving in today's after hours session
Let's have a look at what is happening on the US markets after the closing bell on Thursday. Below you can find the top gainers and losers in today's after hours session.
