Investors seeking growth at a reasonable cost should explore ADMA BIOLOGICS INC (NASDAQ:ADMA).
By Mill Chart
Last update: Apr 16, 2025
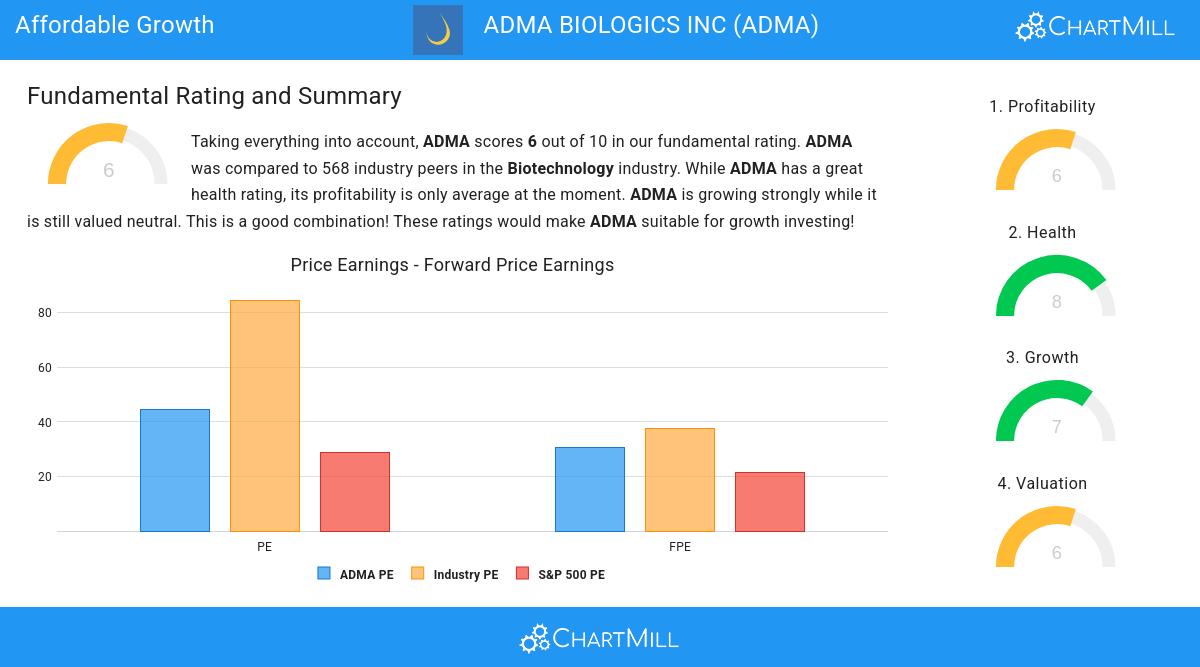
Uncover the potential of ADMA BIOLOGICS INC (NASDAQ:ADMA), a growth stock that our stock screener found to be reasonably priced. ADMA is excelling in growth aspects, maintaining a healthy financial position, and still offers an attractive valuation. We'll examine each aspect in detail.
Growth Examination for ADMA
ChartMill assigns a proprietary Growth Rating to each stock. The score is computed by evaluating various growth aspects, like EPS and revenue growth. We take into account the history as well as the estimated future numbers. ADMA was assigned a score of 7 for growth:
- ADMA shows a strong growth in Earnings Per Share. In the last year, the EPS has been growing by 484.62%, which is quite impressive.
- Looking at the last year, ADMA shows a very strong growth in Revenue. The Revenue has grown by 65.16%.
- ADMA shows a strong growth in Revenue. Measured over the last years, the Revenue has been growing by 70.84% yearly.
- ADMA is expected to show a strong growth in Earnings Per Share. In the coming years, the EPS will grow by 28.09% yearly.
- ADMA is expected to show quite a strong growth in Revenue. In the coming years, the Revenue will grow by 19.52% yearly.
What does the Valuation looks like for ADMA
ChartMill assigns a Valuation Rating to each stock, ranging from 0 to 10. This rating is calculated by analyzing different valuation elements, such as price to earnings and free cash flow, both in absolute terms and relative to the market and industry. In the case of ADMA, the assigned 6 reflects its valuation:
- Based on the Price/Earnings ratio, ADMA is valued cheaply inside the industry as 93.49% of the companies are valued more expensively.
- Based on the Price/Forward Earnings ratio, ADMA is valued cheaply inside the industry as 92.78% of the companies are valued more expensively.
- Based on the Enterprise Value to EBITDA ratio, ADMA is valued cheaper than 94.01% of the companies in the same industry.
- Based on the Price/Free Cash Flow ratio, ADMA is valued cheaply inside the industry as 93.66% of the companies are valued more expensively.
- ADMA's low PEG Ratio(NY), which compensates the Price/Earnings for growth, indicates a rather cheap valuation of the company.
- ADMA has a very decent profitability rating, which may justify a higher PE ratio.
- ADMA's earnings are expected to grow with 35.39% in the coming years. This may justify a more expensive valuation.
Health Assessment of ADMA
ChartMill assigns a Health Rating to every stock. This score ranges from 0 to 10 and evaluates the different health aspects like liquidity and solvency, both absolutely, but also relative to the industry peers. ADMA scores a 8 out of 10:
- ADMA has an Altman-Z score of 24.22. This indicates that ADMA is financially healthy and has little risk of bankruptcy at the moment.
- Looking at the Altman-Z score, with a value of 24.22, ADMA belongs to the top of the industry, outperforming 95.60% of the companies in the same industry.
- The Debt to FCF ratio of ADMA is 0.66, which is an excellent value as it means it would take ADMA, only 0.66 years of fcf income to pay off all of its debts.
- ADMA's Debt to FCF ratio of 0.66 is amongst the best of the industry. ADMA outperforms 95.77% of its industry peers.
- ADMA has a Debt/Equity ratio of 0.21. This is a healthy value indicating a solid balance between debt and equity.
- Although ADMA does not score too well on debt/equity it has very limited outstanding debt, which is well covered by the FCF. We will not put too much weight on the debt/equity number as it may be because of low equity, which could be a consequence of a share buyback program for instance. This needs to be investigated.
- ADMA has a Current Ratio of 5.97. This indicates that ADMA is financially healthy and has no problem in meeting its short term obligations.
- With a decent Current ratio value of 5.97, ADMA is doing good in the industry, outperforming 63.38% of the companies in the same industry.
- ADMA has a Quick Ratio of 2.90. This indicates that ADMA is financially healthy and has no problem in meeting its short term obligations.
How do we evaluate the Profitability for ADMA?
ChartMill utilizes a Profitability Rating to assess stocks, scoring them on a scale of 0 to 10. This rating takes into account a variety of profitability ratios and margins, both in absolute terms and in comparison to industry peers. ADMA has earned a 6 out of 10:
- ADMA has a better Return On Assets (40.45%) than 99.47% of its industry peers.
- ADMA has a Return On Equity of 56.64%. This is amongst the best in the industry. ADMA outperforms 99.12% of its industry peers.
- Looking at the Return On Invested Capital, with a value of 25.35%, ADMA belongs to the top of the industry, outperforming 99.47% of the companies in the same industry.
- With an excellent Profit Margin value of 46.35%, ADMA belongs to the best of the industry, outperforming 99.30% of the companies in the same industry.
- With an excellent Operating Margin value of 32.59%, ADMA belongs to the best of the industry, outperforming 98.77% of the companies in the same industry.
- With a decent Gross Margin value of 51.48%, ADMA is doing good in the industry, outperforming 76.23% of the companies in the same industry.
- In the last couple of years the Gross Margin of ADMA has grown nicely.
Our Affordable Growth screener lists more Affordable Growth stocks and is updated daily.
Check the latest full fundamental report of ADMA for a complete fundamental analysis.
Disclaimer
This article should in no way be interpreted as advice. The article is based on the observed metrics at the time of writing, but you should always make your own analysis and trade or invest at your own responsibility.
21.31
+0.08 (+0.38%)
Find more stocks in the Stock Screener
ADMA Latest News and Analysis
 2 days ago - ChartmillInvestors seeking growth at a reasonable cost should explore ADMA BIOLOGICS INC (NASDAQ:ADMA).
Discover ADMA BIOLOGICS INC, an undervalued growth gem. NASDAQ:ADMA is shining in terms of growth metrics, and it's also displaying strong financial health and profitability, retaining an appealing valuation.
