
Balancing Dividends and Fundamentals: The Case of NYSE:ADM.
By Mill Chart
Last update: Oct 7, 2024
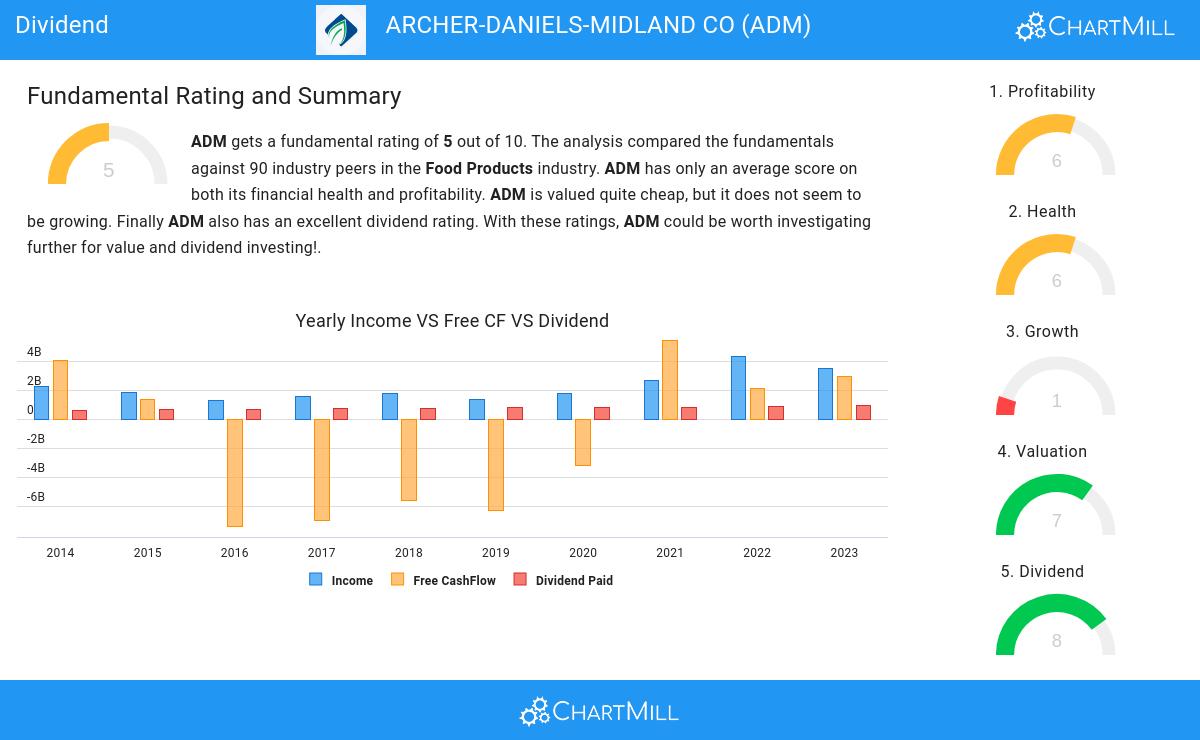
Unearth the potential of ARCHER-DANIELS-MIDLAND CO (NYSE:ADM) as a dividend stock recommended by our stock screening tool. NYSE:ADM maintains a robust financial footing and delivers a sustainable dividend. We'll delve into the details below.
Exploring NYSE:ADM's Dividend
ChartMill employs its own Dividend Rating system for all stocks. This score, on a scale of 0 to 10, is determined by evaluating different dividend factors, such as yield, historical performance, dividend growth, and sustainability. NYSE:ADM has been assigned a 8 for dividend:
- Compared to an average industry Dividend Yield of 3.58, ADM pays a better dividend. On top of this ADM pays more dividend than 83.33% of the companies listed in the same industry.
- Compared to an average S&P500 Dividend Yield of 2.22, ADM pays a better dividend.
- On average, the dividend of ADM grows each year by 6.30%, which is quite nice.
- ADM has paid a dividend for at least 10 years, which is a reliable track record.
- ADM has not decreased its dividend for at least 10 years, so it has a reliable track record of non decreasing dividend.
- ADM pays out 37.91% of its income as dividend. This is a sustainable payout ratio.
What does the Health looks like for NYSE:ADM
ChartMill utilizes a Health Rating to assess stocks, scoring them on a scale of 0 to 10. This rating takes into account a variety of liquidity and solvency ratios, both in absolute terms and in comparison to industry peers. NYSE:ADM has earned a 6 out of 10:
- An Altman-Z score of 3.20 indicates that ADM is not in any danger for bankruptcy at the moment.
- ADM's Altman-Z score of 3.20 is fine compared to the rest of the industry. ADM outperforms 75.56% of its industry peers.
- The Debt to FCF ratio of ADM is 3.34, which is a good value as it means it would take ADM, 3.34 years of fcf income to pay off all of its debts.
- ADM's Debt to FCF ratio of 3.34 is fine compared to the rest of the industry. ADM outperforms 74.44% of its industry peers.
- A Debt/Equity ratio of 0.48 indicates that ADM is not too dependend on debt financing.
What does the Profitability looks like for NYSE:ADM
ChartMill utilizes a Profitability Rating to assess stocks, scoring them on a scale of 0 to 10. This rating takes into account a variety of profitability ratios and margins, both in absolute terms and in comparison to industry peers. NYSE:ADM has earned a 6 out of 10:
- With a decent Return On Assets value of 4.94%, ADM is doing good in the industry, outperforming 64.44% of the companies in the same industry.
- With a decent Return On Equity value of 11.74%, ADM is doing good in the industry, outperforming 67.78% of the companies in the same industry.
- With a decent Return On Invested Capital value of 6.81%, ADM is doing good in the industry, outperforming 67.78% of the companies in the same industry.
- In the last couple of years the Profit Margin of ADM has grown nicely.
- In the last couple of years the Operating Margin of ADM has grown nicely.
- In the last couple of years the Gross Margin of ADM has grown nicely.
Our Best Dividend screener lists more Best Dividend stocks and is updated daily.
For an up to date full fundamental analysis you can check the fundamental report of ADM
Keep in mind
Important Note: The content of this article is not intended as trading advice. It is essential to perform your own analysis and exercise caution when making trading decisions. The article presents observations created by automated analysis but does not guarantee any trading or investment outcomes. Always trade responsibly and make independent judgments.