
Analyzing NYSE:ADM's Dividend Potential.
By Mill Chart
Last update: Sep 16, 2024
Unearth the potential of ARCHER-DANIELS-MIDLAND CO (NYSE:ADM) as a dividend stock recommended by our stock screening tool. NYSE:ADM maintains a robust financial footing and delivers a sustainable dividend. We'll delve into the details below.
A Closer Look at Dividend for NYSE:ADM
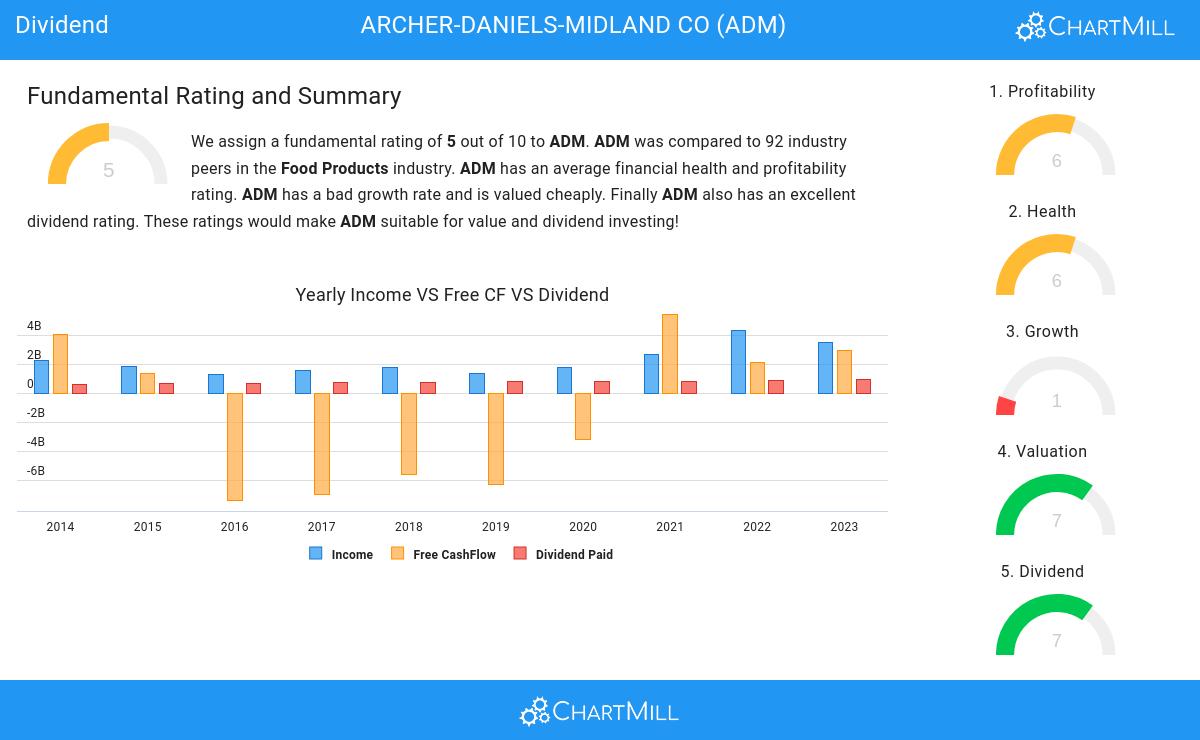
To gauge a stock's dividend quality, ChartMill utilizes a Dividend Rating ranging from 0 to 10. This comprehensive assessment considers various dividend aspects, including yield, history, growth, and sustainability. NYSE:ADM has achieved a 7 out of 10:
- Compared to an average industry Dividend Yield of 3.61, ADM pays a better dividend. On top of this ADM pays more dividend than 83.70% of the companies listed in the same industry.
- ADM's Dividend Yield is a higher than the S&P500 average which is at 2.26.
- On average, the dividend of ADM grows each year by 6.30%, which is quite nice.
- ADM has paid a dividend for at least 10 years, which is a reliable track record.
- ADM has not decreased its dividend for at least 10 years, so it has a reliable track record of non decreasing dividend.
- ADM pays out 37.91% of its income as dividend. This is a sustainable payout ratio.
Understanding NYSE:ADM's Health
Every stock is evaluated by ChartMill, receiving a Health Rating on a scale of 0 to 10. This assessment considers different health aspects, including liquidity and solvency, both in absolute terms and relative to industry peers. NYSE:ADM has achieved a 6 out of 10:
- ADM has an Altman-Z score of 3.21. This indicates that ADM is financially healthy and has little risk of bankruptcy at the moment.
- The Altman-Z score of ADM (3.21) is better than 76.09% of its industry peers.
- ADM has a debt to FCF ratio of 3.34. This is a good value and a sign of high solvency as ADM would need 3.34 years to pay back of all of its debts.
- ADM's Debt to FCF ratio of 3.34 is fine compared to the rest of the industry. ADM outperforms 75.00% of its industry peers.
- ADM has a Debt/Equity ratio of 0.48. This is a healthy value indicating a solid balance between debt and equity.
Profitability Insights: NYSE:ADM
ChartMill employs its own Profitability Rating system for stock evaluation. This score, ranging from 0 to 10, is derived from an analysis of diverse profitability metrics and margins. In the case of NYSE:ADM, the assigned 6 is noteworthy for profitability:
- The Return On Assets of ADM (4.94%) is better than 65.22% of its industry peers.
- Looking at the Return On Equity, with a value of 11.74%, ADM is in the better half of the industry, outperforming 67.39% of the companies in the same industry.
- ADM's Return On Invested Capital of 6.81% is fine compared to the rest of the industry. ADM outperforms 68.48% of its industry peers.
- ADM's Profit Margin has improved in the last couple of years.
- In the last couple of years the Operating Margin of ADM has grown nicely.
- In the last couple of years the Gross Margin of ADM has grown nicely.
More Best Dividend stocks can be found in our Best Dividend screener.
Check the latest full fundamental report of ADM for a complete fundamental analysis.
Disclaimer
This article should in no way be interpreted as advice. The article is based on the observed metrics at the time of writing, but you should always make your own analysis and trade or invest at your own responsibility.