NASDAQ:ACAD, an undervalued stock with good fundamentals.
By Mill Chart
Last update: Feb 21, 2025
Discover ACADIA PHARMACEUTICALS INC (NASDAQ:ACAD), an undervalued stock highlighted by our stock screener. NASDAQ:ACAD showcases solid financial health and profitability while maintaining an appealing valuation. We'll explore the details.
How do we evaluate the Valuation for NASDAQ:ACAD?
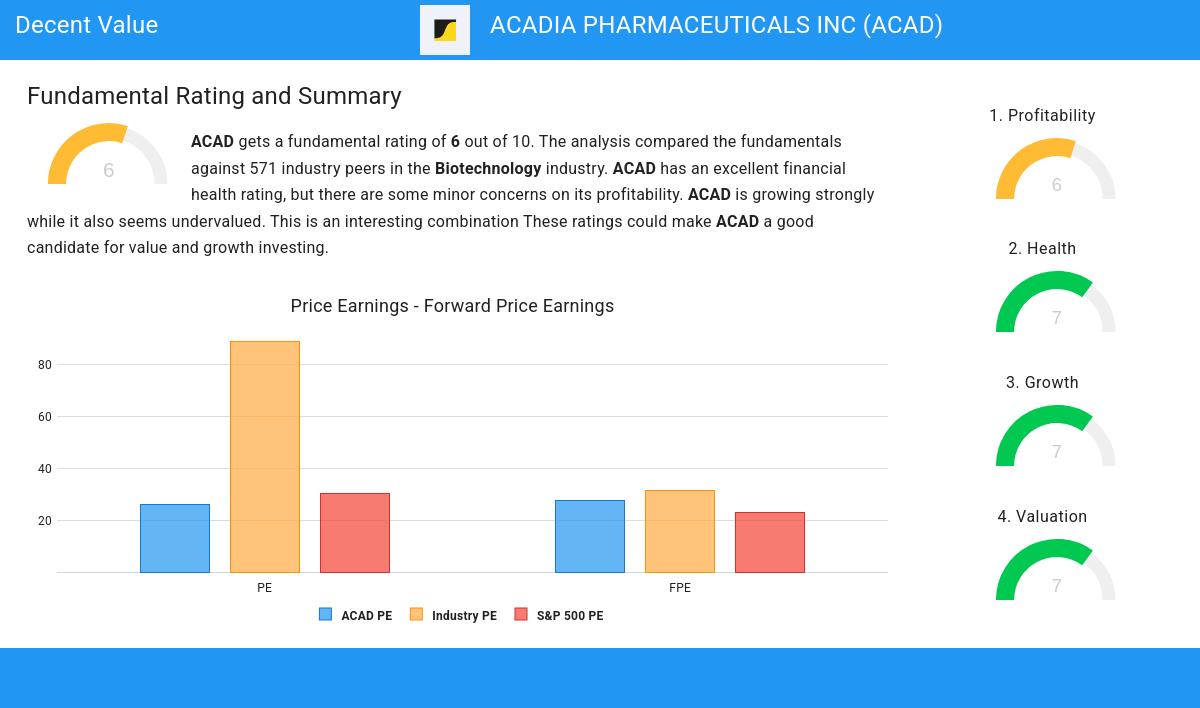
An integral part of ChartMill's stock analysis is the Valuation Rating, which spans from 0 to 10. This rating evaluates diverse valuation factors, including price to earnings and cash flows, while considering the stock's profitability and growth. NASDAQ:ACAD has received a 7 out of 10:
- Based on the Price/Earnings ratio, ACAD is valued cheaper than 95.20% of the companies in the same industry.
- Compared to the rest of the industry, the Price/Forward Earnings ratio of ACAD indicates a rather cheap valuation: ACAD is cheaper than 93.07% of the companies listed in the same industry.
- ACAD's Enterprise Value to EBITDA ratio is rather cheap when compared to the industry. ACAD is cheaper than 95.74% of the companies in the same industry.
- Compared to the rest of the industry, the Price/Free Cash Flow ratio of ACAD indicates a rather cheap valuation: ACAD is cheaper than 96.98% of the companies listed in the same industry.
- The low PEG Ratio(NY), which compensates the Price/Earnings for growth, indicates a rather cheap valuation of the company.
- ACAD has a very decent profitability rating, which may justify a higher PE ratio.
- ACAD's earnings are expected to grow with 70.84% in the coming years. This may justify a more expensive valuation.
Understanding NASDAQ:ACAD's Profitability
ChartMill employs its own Profitability Rating system for stock evaluation. This score, ranging from 0 to 10, is derived from an analysis of diverse profitability metrics and margins. In the case of NASDAQ:ACAD, the assigned 6 is noteworthy for profitability:
- ACAD has a Return On Assets of 13.15%. This is amongst the best in the industry. ACAD outperforms 97.51% of its industry peers.
- With an excellent Return On Equity value of 22.26%, ACAD belongs to the best of the industry, outperforming 97.51% of the companies in the same industry.
- Looking at the Return On Invested Capital, with a value of 14.01%, ACAD belongs to the top of the industry, outperforming 97.16% of the companies in the same industry.
- ACAD's Profit Margin of 13.83% is amongst the best of the industry. ACAD outperforms 96.09% of its industry peers.
- With an excellent Operating Margin value of 12.08%, ACAD belongs to the best of the industry, outperforming 95.38% of the companies in the same industry.
- ACAD has a better Gross Margin (91.61%) than 93.78% of its industry peers.
Health Assessment of NASDAQ:ACAD
Every stock is evaluated by ChartMill, receiving a Health Rating on a scale of 0 to 10. This assessment considers different health aspects, including liquidity and solvency, both in absolute terms and relative to industry peers. NASDAQ:ACAD has achieved a 7 out of 10:
- An Altman-Z score of 3.58 indicates that ACAD is not in any danger for bankruptcy at the moment.
- ACAD's Altman-Z score of 3.58 is fine compared to the rest of the industry. ACAD outperforms 76.55% of its industry peers.
- ACAD has no outstanding debt. Therefor its Debt/Equity and Debt/FCF ratios are 0 and belong to the best of the industry.
- A Current Ratio of 2.29 indicates that ACAD has no problem at all paying its short term obligations.
- A Quick Ratio of 2.11 indicates that ACAD has no problem at all paying its short term obligations.
Evaluating Growth: NASDAQ:ACAD
A key component of ChartMill's stock assessment is the Growth Rating, which spans from 0 to 10. This rating evaluates diverse growth factors, such as EPS and revenue growth, considering both past performance and future projections. NASDAQ:ACAD has received a 7 out of 10:
- ACAD shows a strong growth in Earnings Per Share. In the last year, the EPS has been growing by 184.78%, which is quite impressive.
- The Revenue has grown by 47.05% in the past year. This is a very strong growth!
- ACAD shows a strong growth in Revenue. Measured over the last years, the Revenue has been growing by 26.55% yearly.
- Based on estimates for the next years, ACAD will show a very strong growth in Earnings Per Share. The EPS will grow by 53.74% on average per year.
- The Revenue is expected to grow by 14.36% on average over the next years. This is quite good.
Every day, new Decent Value stocks can be found on ChartMill in our Decent Value screener.
Check the latest full fundamental report of ACAD for a complete fundamental analysis.
Disclaimer
This is not investing advice! The article highlights some of the observations at the time of writing, but you should always make your own analysis and invest based on your own insights.
20.29
+0.62 (+3.15%)
Find more stocks in the Stock Screener
ACAD Latest News and Analysis
 a minute ago - ChartmillNASDAQ:ACAD, an undervalued stock with good fundamentals.
ACADIA PHARMACEUTICALS INC is a hidden gem, featuring undervaluation and robust fundamentals. NASDAQ:ACAD showcases decent financial health and profitability, coupled with an attractive price.
 4 days ago - ChartmillWhile growth is established for NASDAQ:ACAD, the stock's valuation remains reasonable.
ACADIA PHARMACEUTICALS INC was identified as an affordable growth stock. NASDAQ:ACAD is showing great growth, but also scores well on profitability. At the same time it seems to be priced reasonably.
