Bullish Harami Pattern - Beyond the Pregnant Candle: A Complete Guide to Modern Reversals
The Bullish Harami at a Glance
-
What is it? A two-candle bullish reversal pattern that signals a potential shift from a downtrend to an uptrend.
-
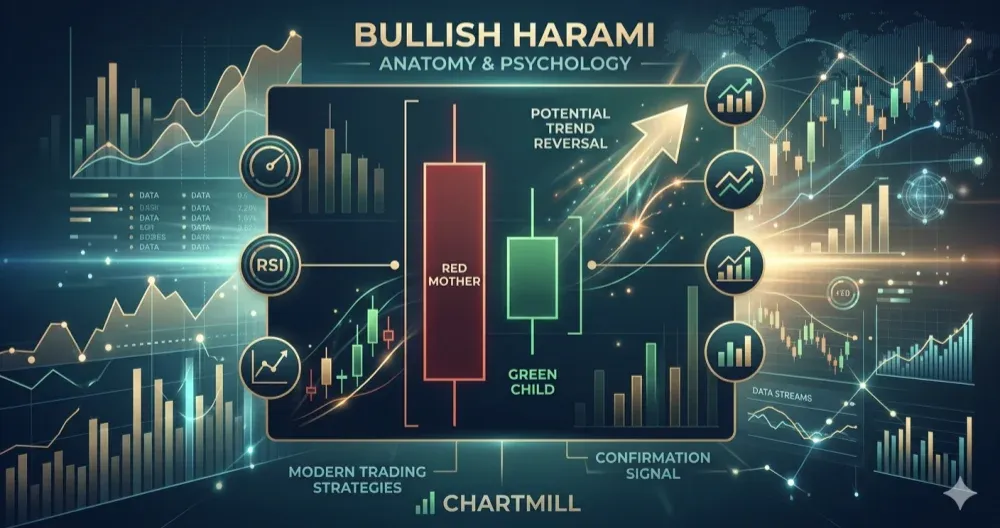
How to identify it? A large red "mother" candle followed by a smaller green "child" candle that is completely contained within the first candle's body.
-
The Psychology: It indicates that selling pressure is drying up and buyers are starting to step back into the market.
-
Golden Rule: Never trade the pattern in isolation. Always wait for confirmation (a third green candle) and use indicators like RSI or volume.
-
Quick Tool: Use the ChartMill Bullish Harami Screener to find these setups automatically in real-time.
I remember the first time I sat in front of a flickering monitor, trying to make sense of the chaotic dance of red and green bars. It felt like trying to read a language where the alphabet changed every five minutes.
But then, I stumbled upon the work of Steve Nison and the ancient Japanese art of candlestick charting.. Suddenly, the chaos had a rhythm. Among the dozens of formations I studied, one always stood out to me for its subtle elegance and its oddly poetic name: the bullish harami.
The term "Harami" is the old Japanese word for "pregnant". When you look at a bullish harami candle setup, you can see why. The first large candle acts as the "mother," and the second, smaller candle is the "child" or "fetus" nestled safely within the mother’s body.
While it might not look as aggressive as a Hammer or as dominant as a Bullish Engulfing pattern, don't let its small stature fool you. In my years of tracking price action, I’ve found that the bullish harami is often the quiet whisper that precedes a market roar.
The Anatomy of a Reversal: Identifying the Bullish Harami Pattern
To trade this pattern successfully, we have to be meticulous. A true bullish harami pattern isn't just any two candles; it requires a very specific set of conditions to be met before I even consider it a valid signal.
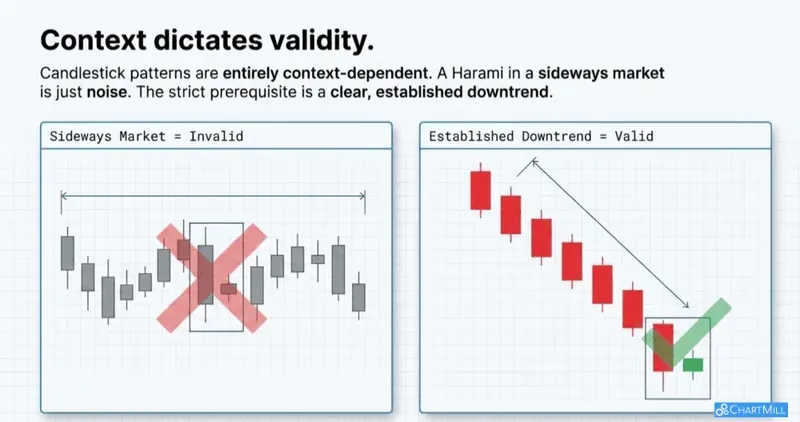
First, we need a clear, established downtrend. Candlestick patterns are, at their core, context-dependent. A Harami in a sideways market is just noise; a Harami at the bottom of a steep decline is a potential goldmine.
The pattern itself consists of two candles:
-
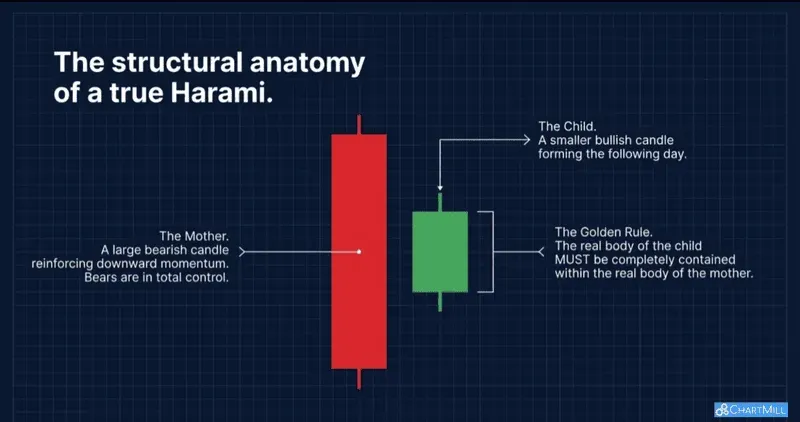
The Mother Candle: This must be a large bearish (red or black) candle that reinforces the ongoing downward momentum. It shows the bears are in total control.
-
The Child Candle: This is a smaller bullish (green or white) candle that forms the following day.
The critical "Golden Rule" of the bullish harami is that the body of the second candle must be completely contained within the real body of the first candle. I pay close attention to the real bodies, the shadows (wicks) are less important here, though some purists prefer the shadows to be contained as well.
The Psychology of the "Pause": What’s Happening Inside the Womb?
Why does this work? To understand the bullish harami, you have to understand the emotional health of the market.
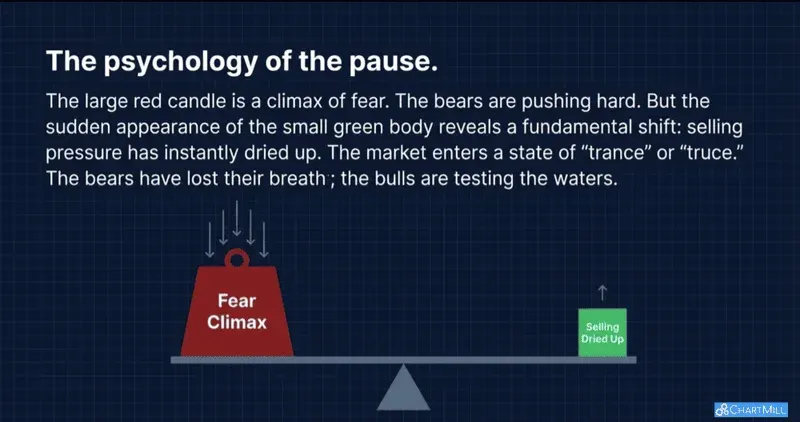
The large red candle represents a climax of fear. The bears are pushing hard, confident in their dominance. But then, something changes. On the second day, the market gaps up slightly or at least refuses to sink further. The small green body that follows tells me that the selling pressure has suddenly dried up.
In my view, the bullish harami represents a state of "trance" or "truce". The bears have lost their breath, and the bulls are starting to test the waters. It is a moment of profound indecision. The market is holding its breath, waiting to see which way the next surge will go.
As a trader, I love these moments because they represent a low-risk opportunity to catch a trend at its very inception.
The Harami Cross: When Indecision Becomes a Power Signal
While the standard bullish harami is reliable, there is a variation that makes me sit up even straighter: the Bullish Harami Cross.
In this version, the second candle is a Doj, a candle where the opening and closing prices are virtually identical. If a small candle represents indecision, a Doji represents a total stalemate.
The Japanese often refer to the Harami Cross as the "petrifying pattern". When I see a Doji contained within a massive bearish body after a long decline, it tells me the prior trend has been completely neutralized.
In fact, research suggests that the Bullish Harami Cross is often more powerful and carries a higher probability of a trend reversal than its standard counterpart.
Statistical Reality: Does the Bullish Harami Actually Make Money?
I’ve always been a fan of blending ancient wisdom with modern data. We often hear "guru" traders claim these patterns work, but what does the math say?
Interestingly, some academic studies are skeptical. Research on the S&P 500 over several decades has shown that many one-candle patterns like the Hammer or Shooting Star have limited reliability when based solely on closing prices.
However, when we look at specific setups for the bullish harami, the numbers get much more interesting. In a massive backtest of 5,624 trades spanning over 100 years of data, the bullish harami showed a profitable win rate of approximately 55.2%.
What does this tell me? It tells me that the bullish harami isn't a magic wand, but it is a statistically significant edge when used correctly. It’s a tool for the disciplined, not a shortcut for the lazy.
Strategic Execution: How I Trade the Bullish Harami Pattern
Knowing what a pattern looks like is only 20% of the battle. The other 80% is execution. I follow a strict three-step process when I see a bullish harami pattern forming.
1. The Search for Confirmation
I never, ever buy a Harami the moment it forms. That’s like jumping off a cliff and hoping you’ll grow wings on the way down. I wait for confirmation.
For a bullish harami, confirmation typically comes when the price breaks above the high of the second (child) candle. Some conservative traders, myself included, often prefer to see a third bullish candle close even higher, proving that the momentum shift is real.
2. Volume Analysis: The Hidden Fuel
Volume is the lie detector of the financial markets. If I see a bullish harami form on high volume in the first candle and then see a significant volume surge on the confirmation candle, my confidence in the trade sky-rockets. Shrinking volume on the second, small candle is also a classic sign that the selling momentum has died.
3. Risk Management: Protecting the Capital
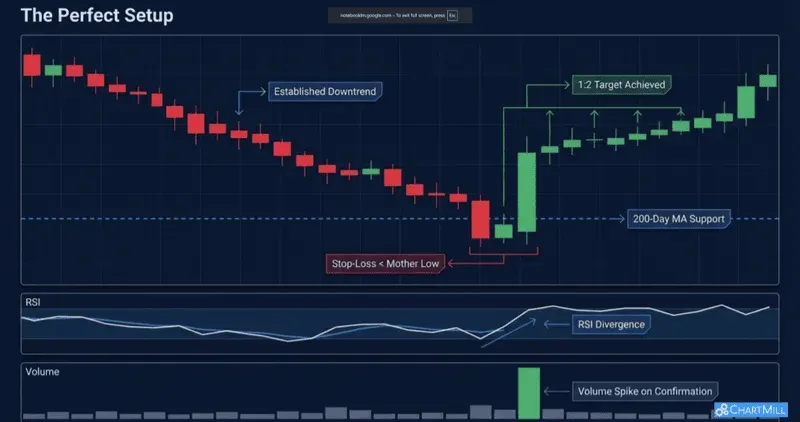
As much as I love a good setup, I love my capital more. My stop-loss is always placed below the low of the "mother" candle. If the price falls below that point, the reversal has failed, and the downtrend is likely resuming.
I aim for a minimum risk-to-reward ratio of 1:2. I usually look at the next major resistance level or a recent swing high as my first target.
Advanced Tips: Confluence and Market Context
The secret to becoming a pro with the bullish harami is looking for "confluence", where multiple indicators tell the same story.
-
Support Levels: A bullish harami that forms right at a major historical support line or a 200-day moving average is infinitely more powerful than one that forms in the middle of nowhere.
-
Oscillators (RSI/Stochastics): If the RSI is showing an "oversold" reading (below 30) at the same time the Harami appears, you’ve got a classic "Buy" signal. Even better is a "positive divergence," where the price makes a new low but the RSI doesn't, this is a strong indicator that the bears are exhausted.
-
Fibonacci Retracements: I often look for Haramis at the 61.8% retracement level. It’s remarkable how often ancient math and ancient charting converge at the exact same price point.
Personal Take: A Hidden Gem or an Outdated Relic?
In an age of high-frequency trading and complex algorithms, some traders dismiss candlestick patterns as "voodoo" or outdated. I couldn't disagree more.
Patterns like the bullish harami represent human psychology - fear, greed, and indecision - which hasn't changed in hundreds of years.
My light personal opinion?
The Harami is often overlooked because it’s not as "loud" as other patterns. It doesn't have the violent rejection of a Pin Bar. It’s subtle. It’s a pause. But in the markets, sometimes the most important thing you can do is listen to the silence between the moves.
I’ve found that the most profitable trades aren't the ones where I chase a breakout, but the ones where I recognize a Harami forming at a key support level, wait for my confirmation, and quietly enter while the rest of the market is still panicking.
Conclusion: Your Next Step in the Journey
The bullish harami is more than just a "pregnant" candle. It is a visual representation of a market finding its footing. It tells a story of a exhausted seller and a hesitant buyer slowly finding their courage.
As you move forward, I encourage you to open up your favorite charting platform - I personally love the clarity of ChartMill's tools - and look back at historical charts.
Don't take my word for it. Find the downtrends, spot the bullish harami candle setups, and see how the volume and RSI behaved.
Successful trading is about patience and discipline. Wait for the pattern. Wait for the confirmation. Respect your stops. If you do that, you’ll find that the "child" candle can indeed grow into a very profitable "adult" rally.
Final Pro-Tip: Always backtest a pattern on your specific asset class before trading live. Every market has its own "personality", what works for Soybeans might need a slight adjustment for Tech stocks. Happy hunting!
Kristoff - ChartMill
FAQ: Everything You Need to Know About the Bullish Harami Pattern
1. Is a Bullish Harami always a reversal signal?
"While the bullish harami pattern is primarily known as a reversal signal, it is technically a 'warning' sign. It indicates that the current downtrend is losing momentum. For a confirmed reversal, you always need to wait for a third green candle to close above the pattern."
2. Does the second candle in a Bullish Harami have to be green?
"Ideally, yes. For the strongest bullish harami candle setup, the second (smaller) candle should be green (bullish). While a red-red harami is technically possible and signals a 'pause', a red-green combination shows that buyers are actively starting to push the price back up."
3. What is the difference between a Bullish Harami and a Bullish Engulfing pattern?
"The main difference lies in the size of the second candle. In a bullish engulfing pattern, the second candle 'swallows' the first one completely, signaling aggressive buying. In a bullish harami, the second candle is smaller and contained within the first, signaling a more subtle shift in sentiment and a potential bottom."
4. How reliable is the Bullish Harami pattern?
"The bullish harami is considered moderately reliable. Its success rate increases significantly when it occurs at a major support level or when combined with oversold signals from indicators like the RSI (Relative Strength Index). Most professional traders use it as a 'heads-up' rather than a direct buy signal."
5. Can a Bullish Harami occur on any timeframe?
"Yes, you can spot a bullish harami pattern on everything from 5-minute charts to monthly charts. However, like most candlestick patterns, it carries more weight and is more reliable on higher timeframes, such as the daily or weekly charts."
Interested in spotting market tops? Read our companion guide on the Bearish Harami Pattern.