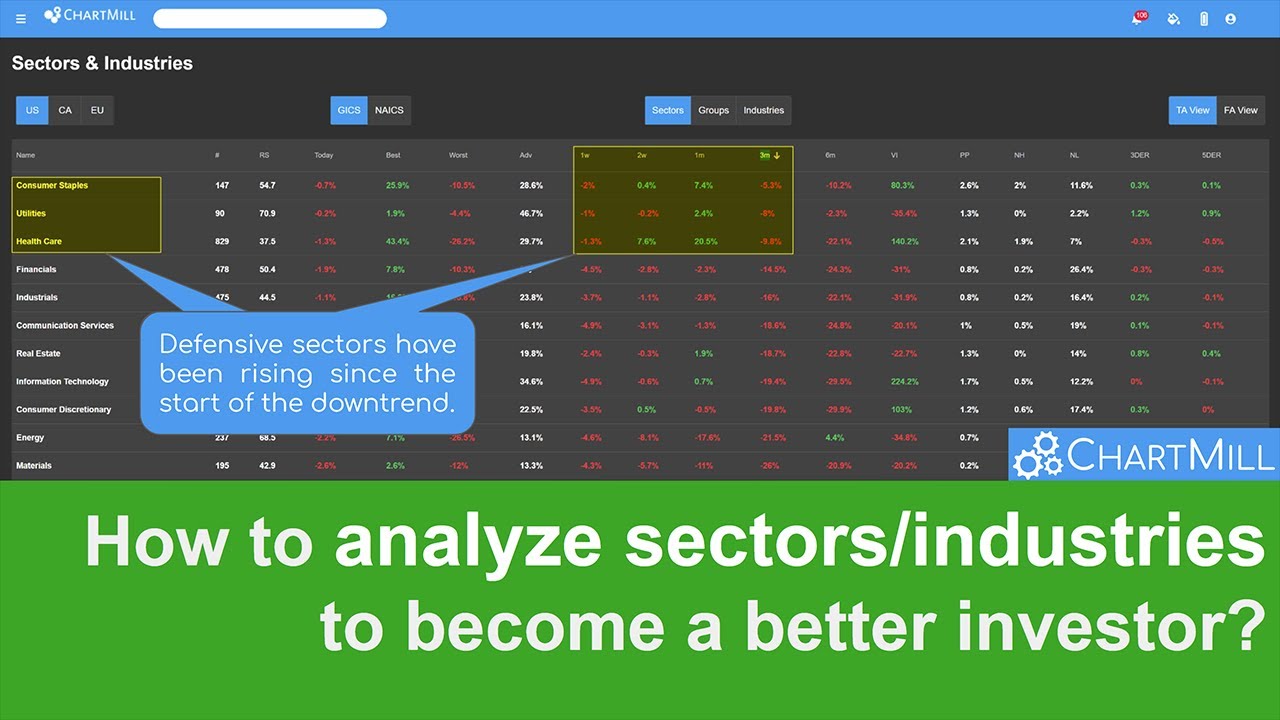
Step-by-Step Guide on How to Set Up a Sector-Based Stock Screening List Using ChartMill
By Kristoff De Turck - reviewed by Aldwin Keppens
~ 5 minutes read - Last update: Sep 19, 2024

ChartMill is a versatile stock screener that allows investors to customize their screening process based on both technical and fundamental indicators. Setting up a sector-based stock screener on ChartMill is a straightforward process that can help you identify the best-performing stocks within a specific sector.
This guide will walk you through the steps to create your own sector-based stock screener using ChartMill.
Keep in mind that the example screen shown in this article is deliberately kept very simple. We mainly want to introduce you to the different steps by which you can put together a screen like this.
Step 1: Create a ChartMill Account
Before you begin, you'll need to create a ChartMill account if you don't already have one.
No ChartMill account yet? Then go to the homepage, sign up for a free account (no payment information is asked) and start using our screener immediately.

Step 2: Access the Stock Screener
Once you're logged in, you'll need to navigate to the stock screener section of the platform.
- Select “Stock Screener” from the main menu on the left side of the page (if the main menu is not visible, click the three dashes at the top left). This will display the main Stock Screener interface.
- Familiarize yourself with the layout, which includes various filters and options for customizing your search.
Step 3: Set the Sector Filter
The first step in setting up a sector-based stock screener is to filter stocks by the sector you’re interested in.
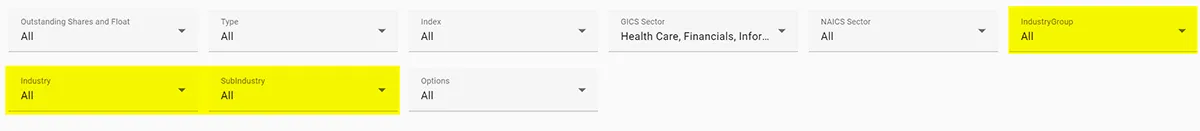
- Locate the Sector filter: On the left side of the screener interface, select the “General” tab. Then open the dropdown menu under 'GICS Sector.
- Choose your sector: Now select the sector you want to focus on (e.g., Information Technology, Healthcare, Financials). This will automatically filter out all stocks that do not belong to the selected sector.

If desired, you can further refine the selection within the main sector to one specific industry (group) or even sub-industry. You will find the expanded filtering options on the same tab.
Step 4: Apply Fundamental Filters
Next, apply fundamental analysis filters to refine your stock selection based on financial metrics. In this article, we are using the predefined fundamental ChartMill Ratings. This is a quick and convenient way if you are not yet really familiar with the many fundamental ratios available in the platform.
- Financial Health: These filters are used to measure a company's financial health.
- For example: set the ChartMill Health Rating score to at least 6/10.
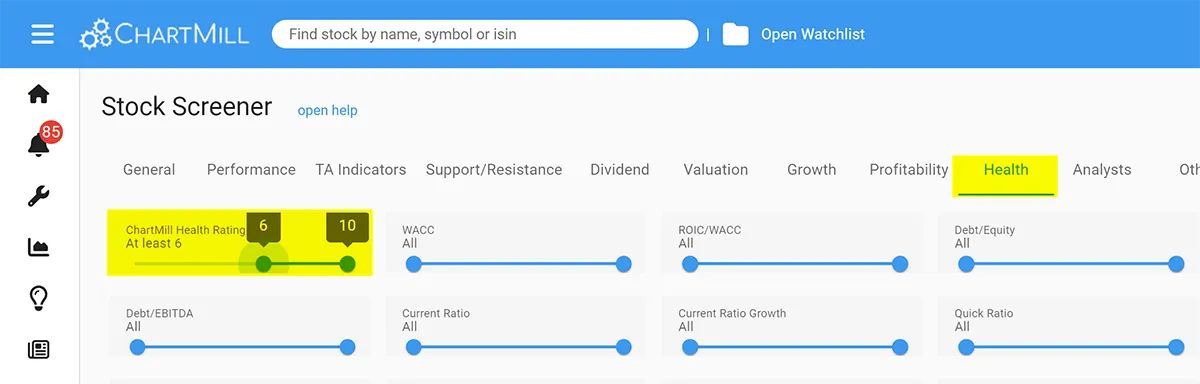
Of course, you can opt to set individual ratios. You can read which ratios are best suited for understanding a company's financial condition here.
- Growth Metrics: These filters are used to select companies capable of strong (and rapid) growth.
- For example: set the ChartMill Growth Rating score to at least 7/10
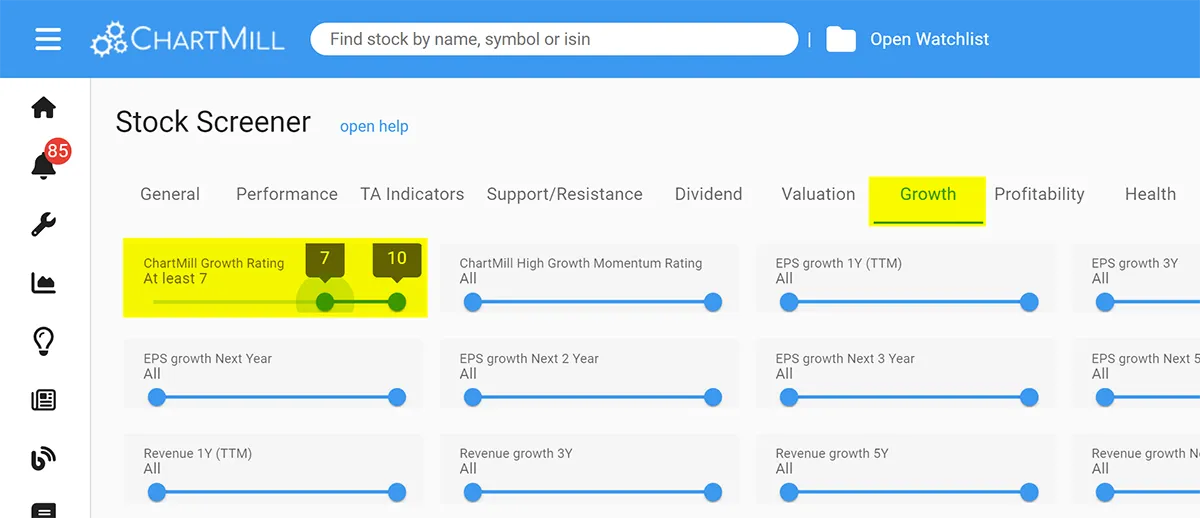
Again, you can opt to use individual growth filters. More information about which ratios you can use for this purpose can be found in this article.
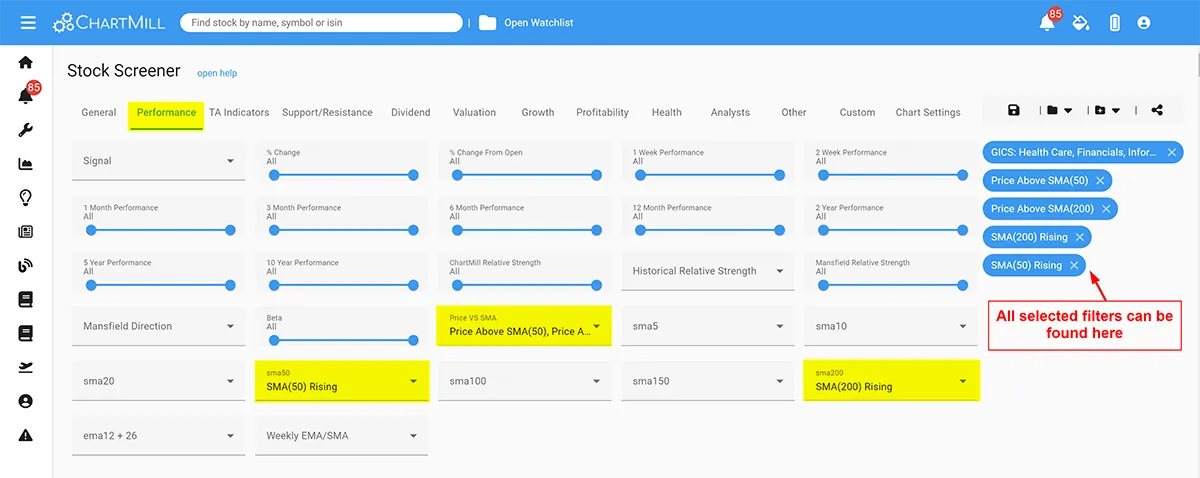
Step 5: Apply Technical Filters
To further refine your search, you can apply some technical analysis filters. These are particularly useful for identifying stocks with strong price trends or specific trading requirements.
- Trend Indicator: Use filters like Moving Averages (e.g., 50-day or 200-day) to find stocks that are trending upwards within the selected sector.
- For example: Set a filter for stocks trading above their 50- and 200-day moving average, indicating a bullish trend on the mid- and long-term
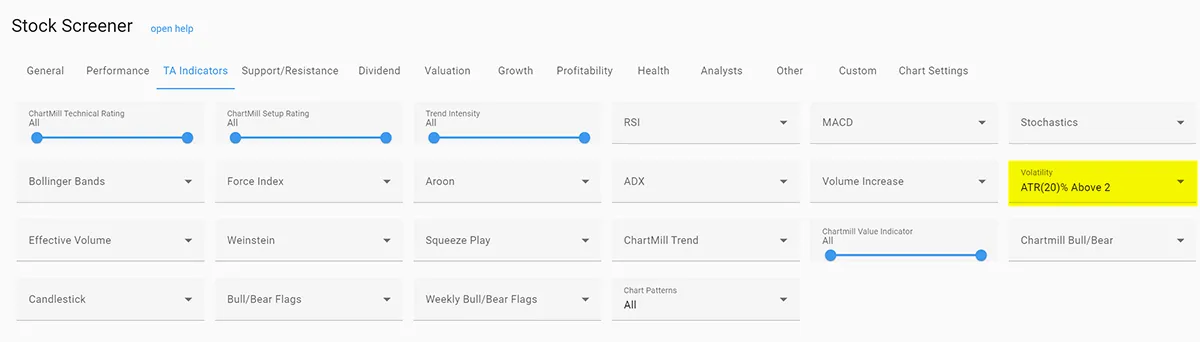
- Volatility Indicator: Use the ATR or ADR indicator to find sufficiently volatile stocks. Especially when using an active swing trading strategy, it is important to pay attention to stocks with slightly higher volatility. If you buy stocks to keep them in your portfolio for a long time, this is less important.
- For example: Use the “ATR(20%) above 2” filter to exclude stocks where price movement is insufficient.
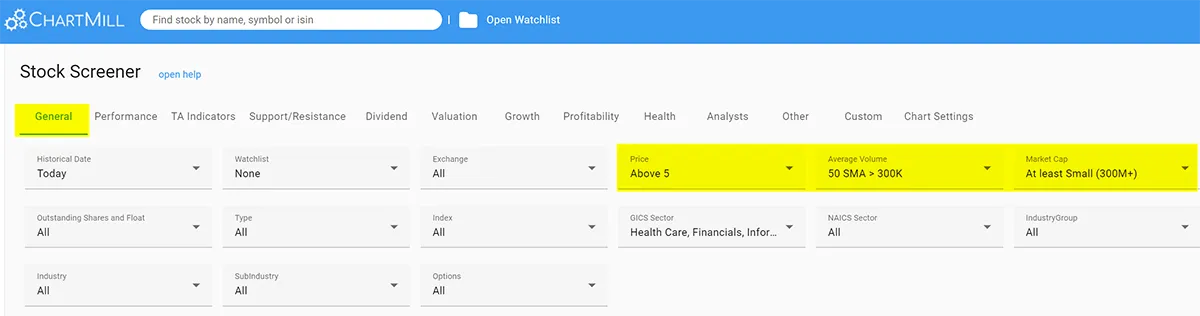
Step 6: Adding Some General Filters
To ensure that we exclude underpriced stocks and stocks with too little trading volume, we add a few more basic filters.
-
Price Filter: To exclude low-priced stocks
-
For example: Set a minimum of $5
-
Market Cap Filter: To exclude stocks of companies with a market capitalization that is too low.
-
For example: Use a Market Cap of at least $300M (Small Caps)
-
Volume Filter: To exclude stock with too low daily trading volume
-
For Example: Use a minimum daily average trading volume of at least 300M
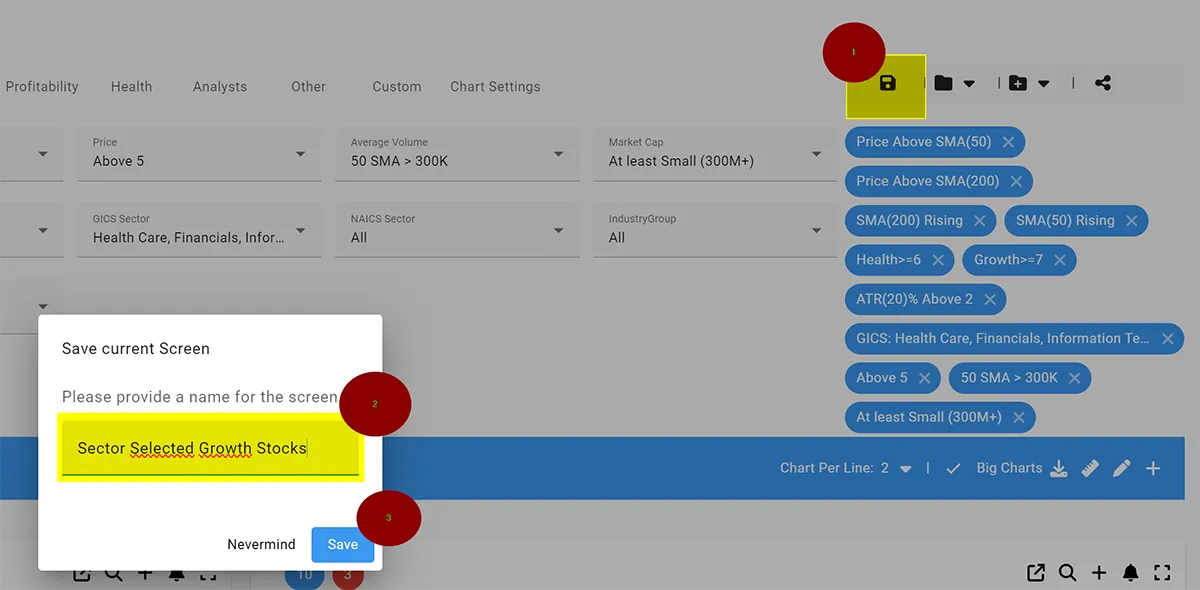
Step 7: Customize and Save Your Screener
After applying all your desired filters, you can customize and save your screener for future use.
- Review your filter settings: Ensure all your filters (sector, fundamental, and technical) are correctly set up to match your investment strategy.
- Save the screener: Click on the “Save Screener” option, found at the top of the screener interface. Name your screener something descriptive, such as “Sector Selected Growth Stocks,” so you can easily identify it later.
Step 8: Analyze and Export Results
Once your screener is set up, you can analyze the results and decide which stocks to investigate further.
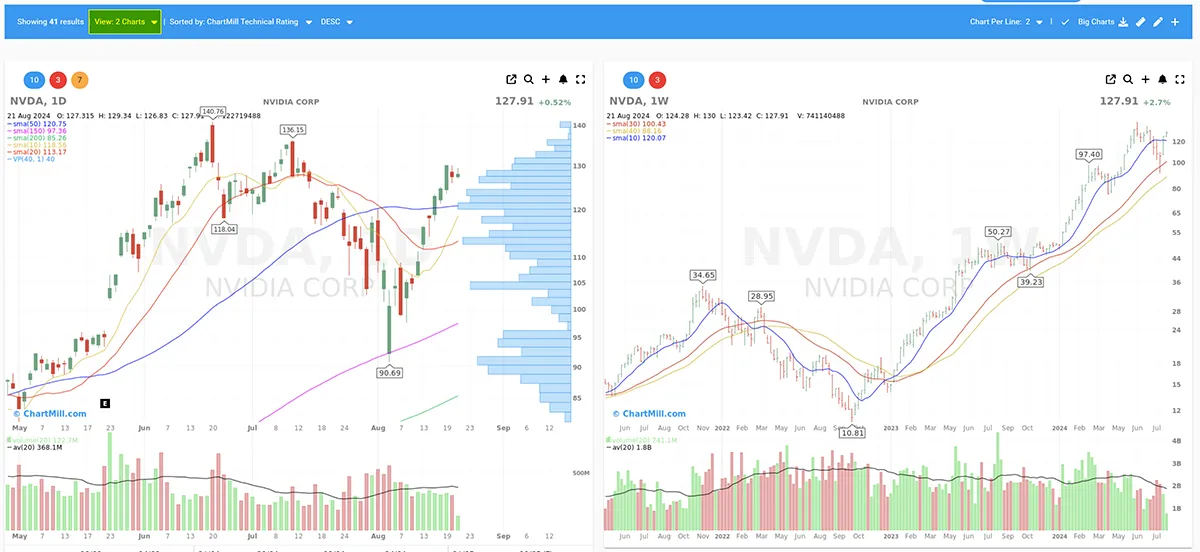
- View the results: The stocks that meet your criteria will be displayed in a list. There are numerous ways to view and analyze the results.
- For example: Use the 2 charts view to display 2 charts of the same stock side by side at different time intervals. (daily/weekly, weekly/monthly,...)
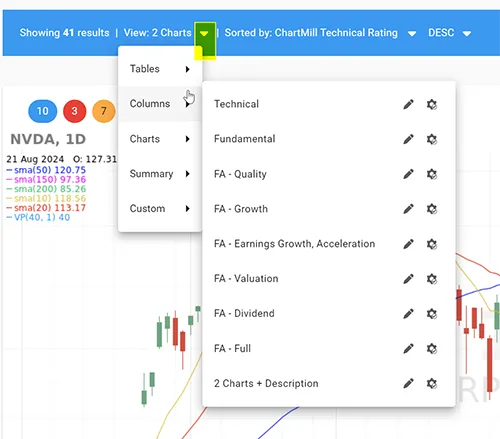
Tip 1: Numerous other view options are available in the screener, discover them all by clicking on the inverted triangle which reveals a dropdown menu.
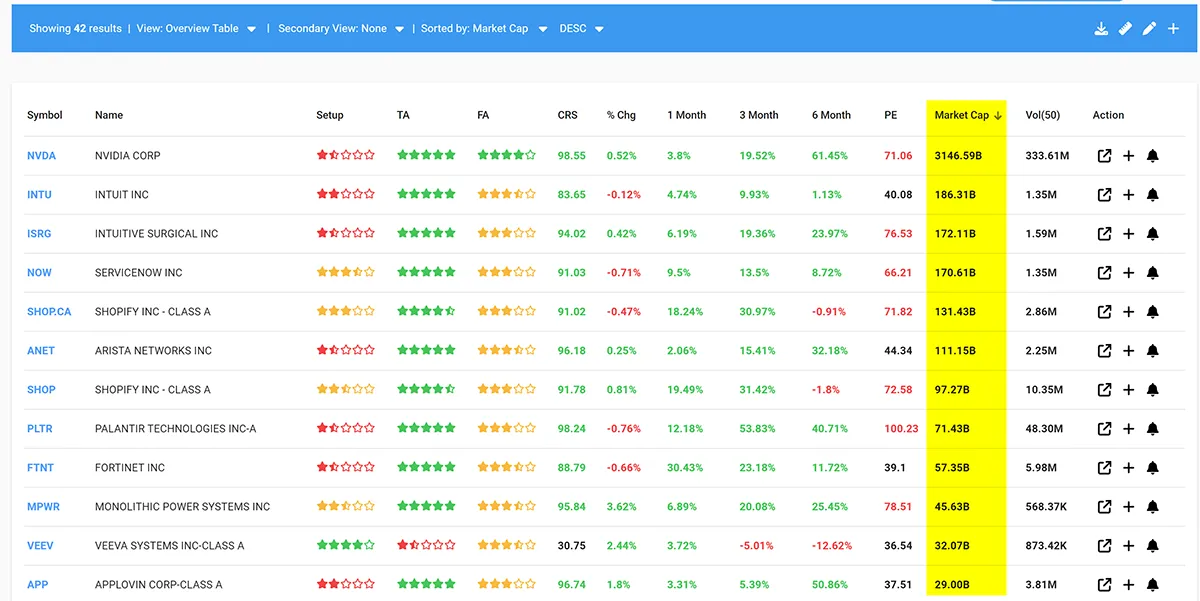
Tip 2: When using the ‘Tables View’, you can sort the results by various columns (e.g., market cap, P/E ratio) to prioritize your analysis.
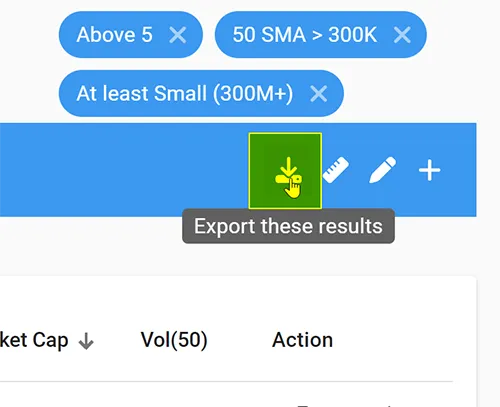
- Export data: If you want to analyze the data further or keep records, ChartMill allows you to export the list of stocks to a CSV file. This can be useful for creating reports or integrating with other analysis tools.
Step 9: Conduct In-Depth Analysis
Finally, take the time to conduct a deeper analysis of the top stocks identified by your screener.
- Use ChartMill’s detailed fudamental and technical stock reports: Click on individual stocks to view their full profile, including financial statements, estimates, and analyst ratings.
- Cross-reference with other tools: You may also want to cross-reference your findings with other financial tools or platforms to ensure you have a comprehensive view of each stock’s potential.
Conclusion: Efficient Sector-Based Screening with ChartMill
Setting up a sector-based stock screener on ChartMill is a powerful way to streamline your investment research process. By filtering stocks based on sector, applying both fundamental and technical criteria, and customizing your screener to fit your strategy, you can efficiently identify the best investment opportunities within a specific sector.
Whether you’re looking for growth stocks in the technology sector or undervalued stocks in healthcare, ChartMill provides the tools you need to build a focused and effective stock screening strategy.