

Problem
- How to spot new potential market leaders at an early stage when stock markets correct?
Solution
- Focus on the strongest performing individual stocks (bottom-up approach)
- Find out which sub-industry these stocks belong to and check whether other stocks in this group are performing correspondingly strongly
- Look for low-risk stage 2 setups within this stock group and start building small test positions
Top-Down & Bottom-Up Approach
Top-down and bottom-up are terms derived from fundamental analysis. In the first case (top-down), the investor analyzes general and macroeconomic factors such as economic growth, monetary policy, inflation, etc. This information is then used to choose which sectors/industries/shares are best to invest in.
In the bottom-up approach, this process is reversed. The investor starts at the company level. Attention is paid to company-specific metrics such as revenue and earnings growth, debt ratio, how much cash the company generates, and what its sustainable competitive advantage is over industry peers.
The distinction between these two approaches also exists within technical analysis.
The technical top-down approach first looks at the general market trend and only if it is positive does one zoom in on which sectors and industries are doing particularly well. Ultimately, one ends up with the best-performing stocks.
However, this approach has the disadvantage that the remaining stocks have already experienced a strong upward trend (the current rotation into small caps with the breakout of the underlying index, recognizing key sectors and zooming in on the best performers is a recent example I wrote about earlier in this post).
To avoid this, the bottom-up approach is used. The premise is that the best-performing stocks lead the overall market trend and that true market leaders bottom out faster in a downward market trend than the indices to which they belong.
These are the stocks that are the first to break out of their Stage 1 accumulation and begin their Stage 2 rise while the general markets are still forming their bases.
Setting Up the Stock Screener
General Settings
Start with some basic filters...
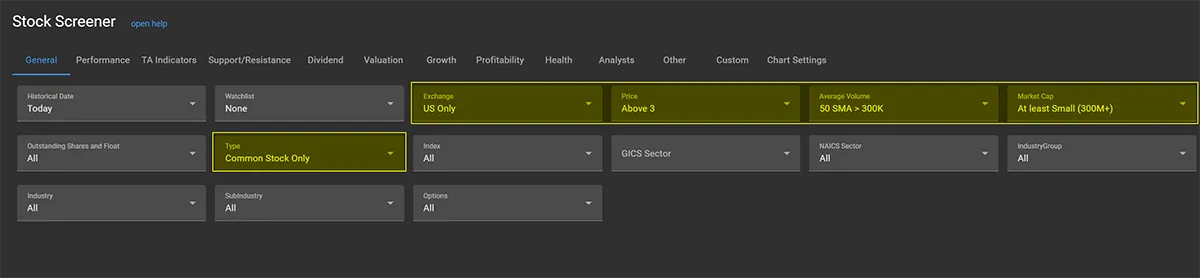
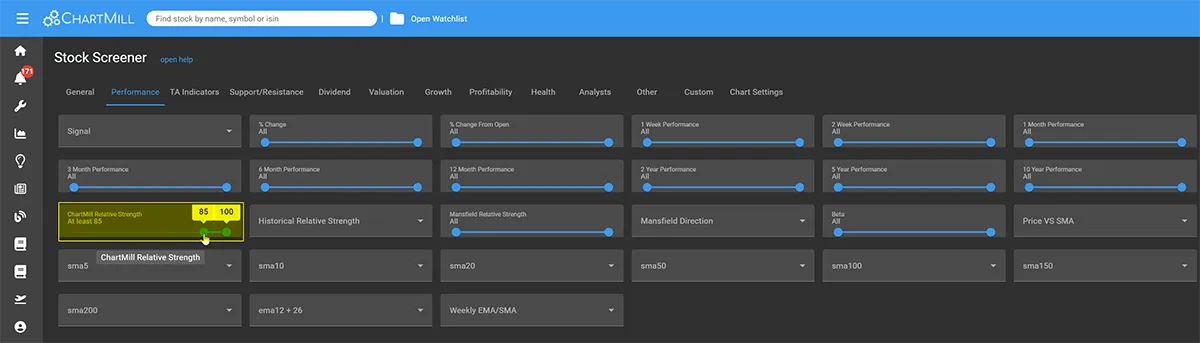
Focus on the Strongest Performing Individual Stocks
Strong stocks are stocks that perform (much) better than all other stocks. The best way to measure that objectively is to examine their Relative Strength.
Warning: Not to be confused with the Relative Strength Indicator (RSI)!
Add an Relative Strength filter with a minimum value of 85. This means that the stock in question must outperform at least 85% of all other US stocks in our database.
Only Select Stocks in a Confirmed Uptrend
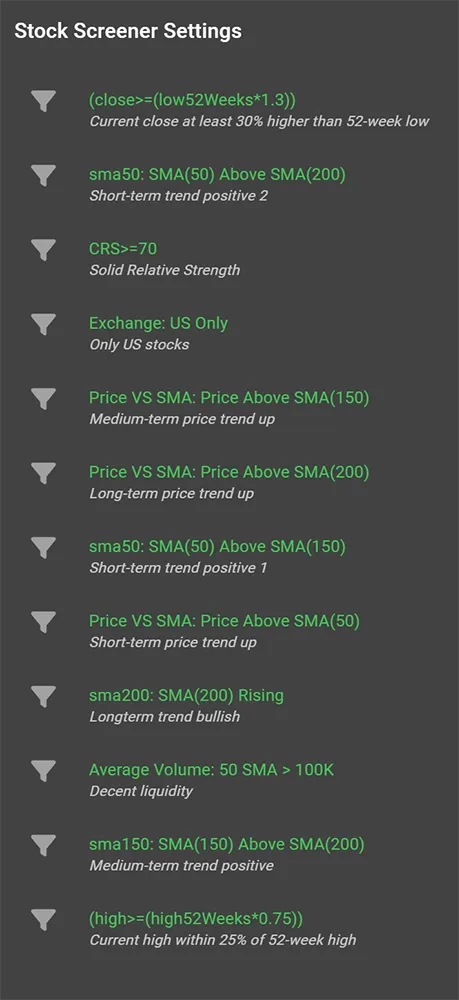
A confirmed uptrend means that the stock shows a clear upward trend in both the medium and long term.
I personally use Mark Minervini's Trend Template filter for this, which is part of his book 'Trade Like a Stock Market Wizard' (you can read more about this template in this article).
It is a combination of several moving averages and also the positioning of the current price relative to the 52-week high and low plays a role.
Tip: You can use the filters as mentioned in the screenshot or you can apply the trading idea directly.
In that case, don't forget to change the Relative Strength Value and some general settings that are different in the screen created in this post.
Analyzing Results
Rank by sector/industry/sub-industry
I recently created this custom table view in ChartMill for personal use.

The left side shows the ticker and the name of the stock. The next four columns are reserved for the GICS classification format. The right side shows how the stock has performed the last, 6 and 12 months with the ChartMill Relative Strength Rating next to it.
To make this custom table view yourself, watch this video (custom table view starts at 01:00)
The buttons under 'Action' allow you to:
- open the profile page of the stock,
- add the stock to a watchlist,
- Set a specific alert for the stock,
This view is useful when you want to get a quick and clear overview of the strongest performing sectors and industries within your stock lists or screens. ChartMill even allows screening down to the level of different sub-industries.
Each column in this view can be sorted from high to low or vice versa. For the GICS classification columns, clicking once on the column title will cause the stocks belonging to the same sector/industry or sub-industry to be grouped together (depending on exactly which column you click).
This table makes it easy to understand which areas the strongest performing stocks are in. Combined with the screening filters from this article, you will be able to gain early visibility into the new potential market leaders when sector rotation occurs.
Tip: If you wish to filter the results for specific sectors/industries open the sector drop down menu in the general tab to view one or more specific sectors/industries individually.

Identify low risk setups by Using ChartMill Channels
By applying the trend template, we are already assured that the stocks in this selection are trending upward (stage 2).
The best low risk setups occur when, after an initial rise, a stock experiences a small price reversal and consolidates sideways. What you want to see is the price forming a narrow price range. As soon as the stock then breaks out again, you can take a long position with a stop loss just below the sideways range.
To define such setups within the already existing selection we use the so-called ChartMill Channels (you can read more about this proprietary indicator here).
First change the view settings to 'charts' or '2 charts'.
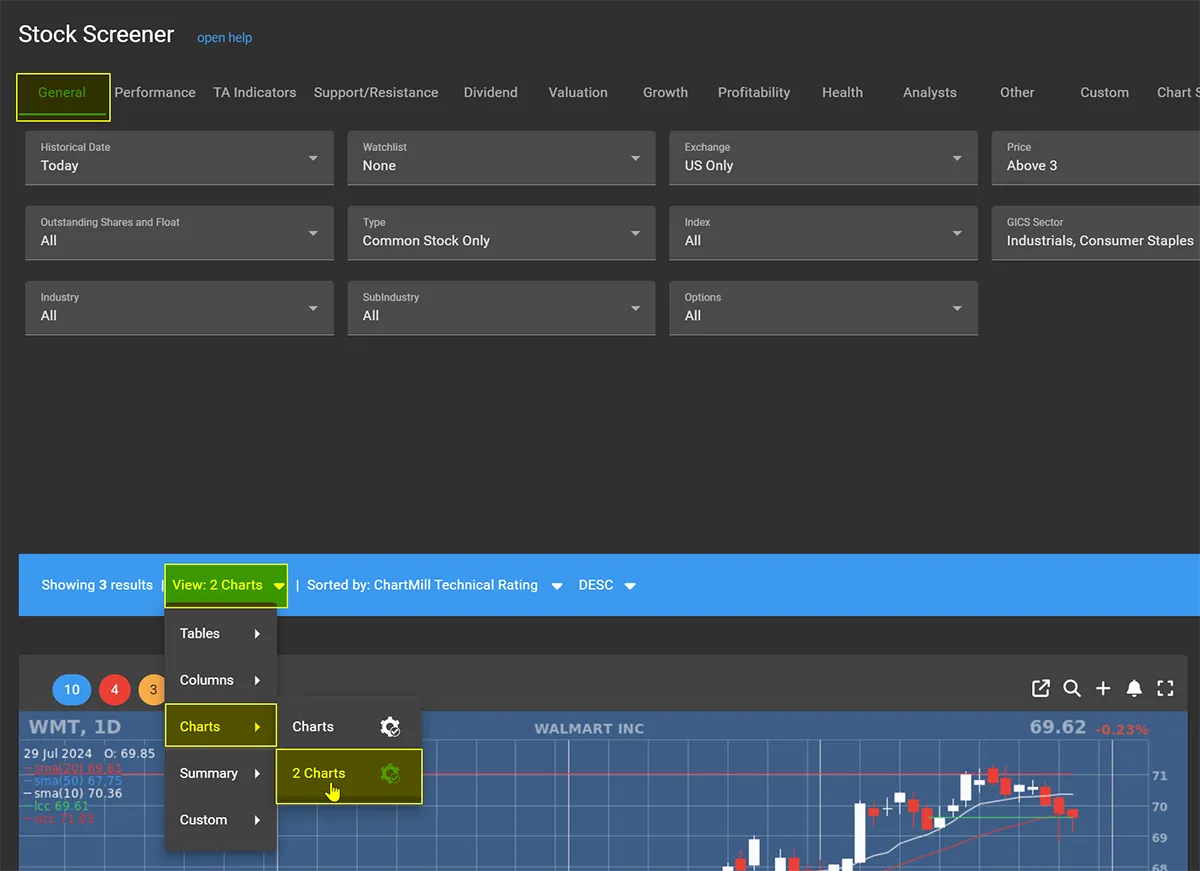
Next, add the ChartMill Channels as an overlay

These will be visible as green (support) and red (resistance) horizontal lines on the chart:
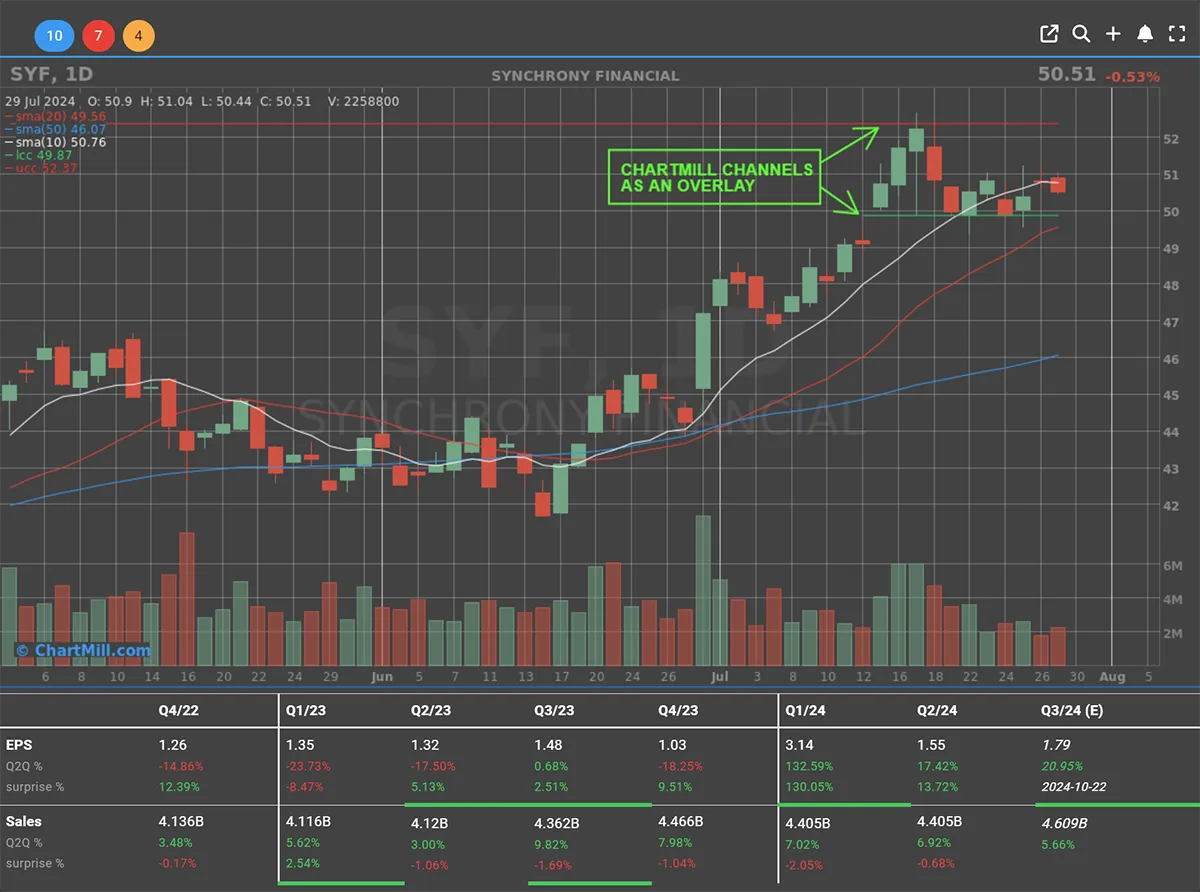
Tip: You can use these ChartMill Channels as an additional screening filter in your initial selection to find stocks with very tight bandwidths, Watch how it's done in this video.
Happy Screening!
The ChartMill Team