In this article, I'm going to show you three different ways you can use the ChartMill stock screener to find undervalued stocks.
But first, let's cover very briefly what exactly is meant by undervalued stocks.
What exactly are "undervalued stocks"?
Undervalued stocks are stocks whose price is believed to be lower than it actually should be. In other words, there is a difference between the current price and the company's fair or intrinsic value.
By intrinsic value we mean the difference between the market value and goodwill, set against the company's debts.
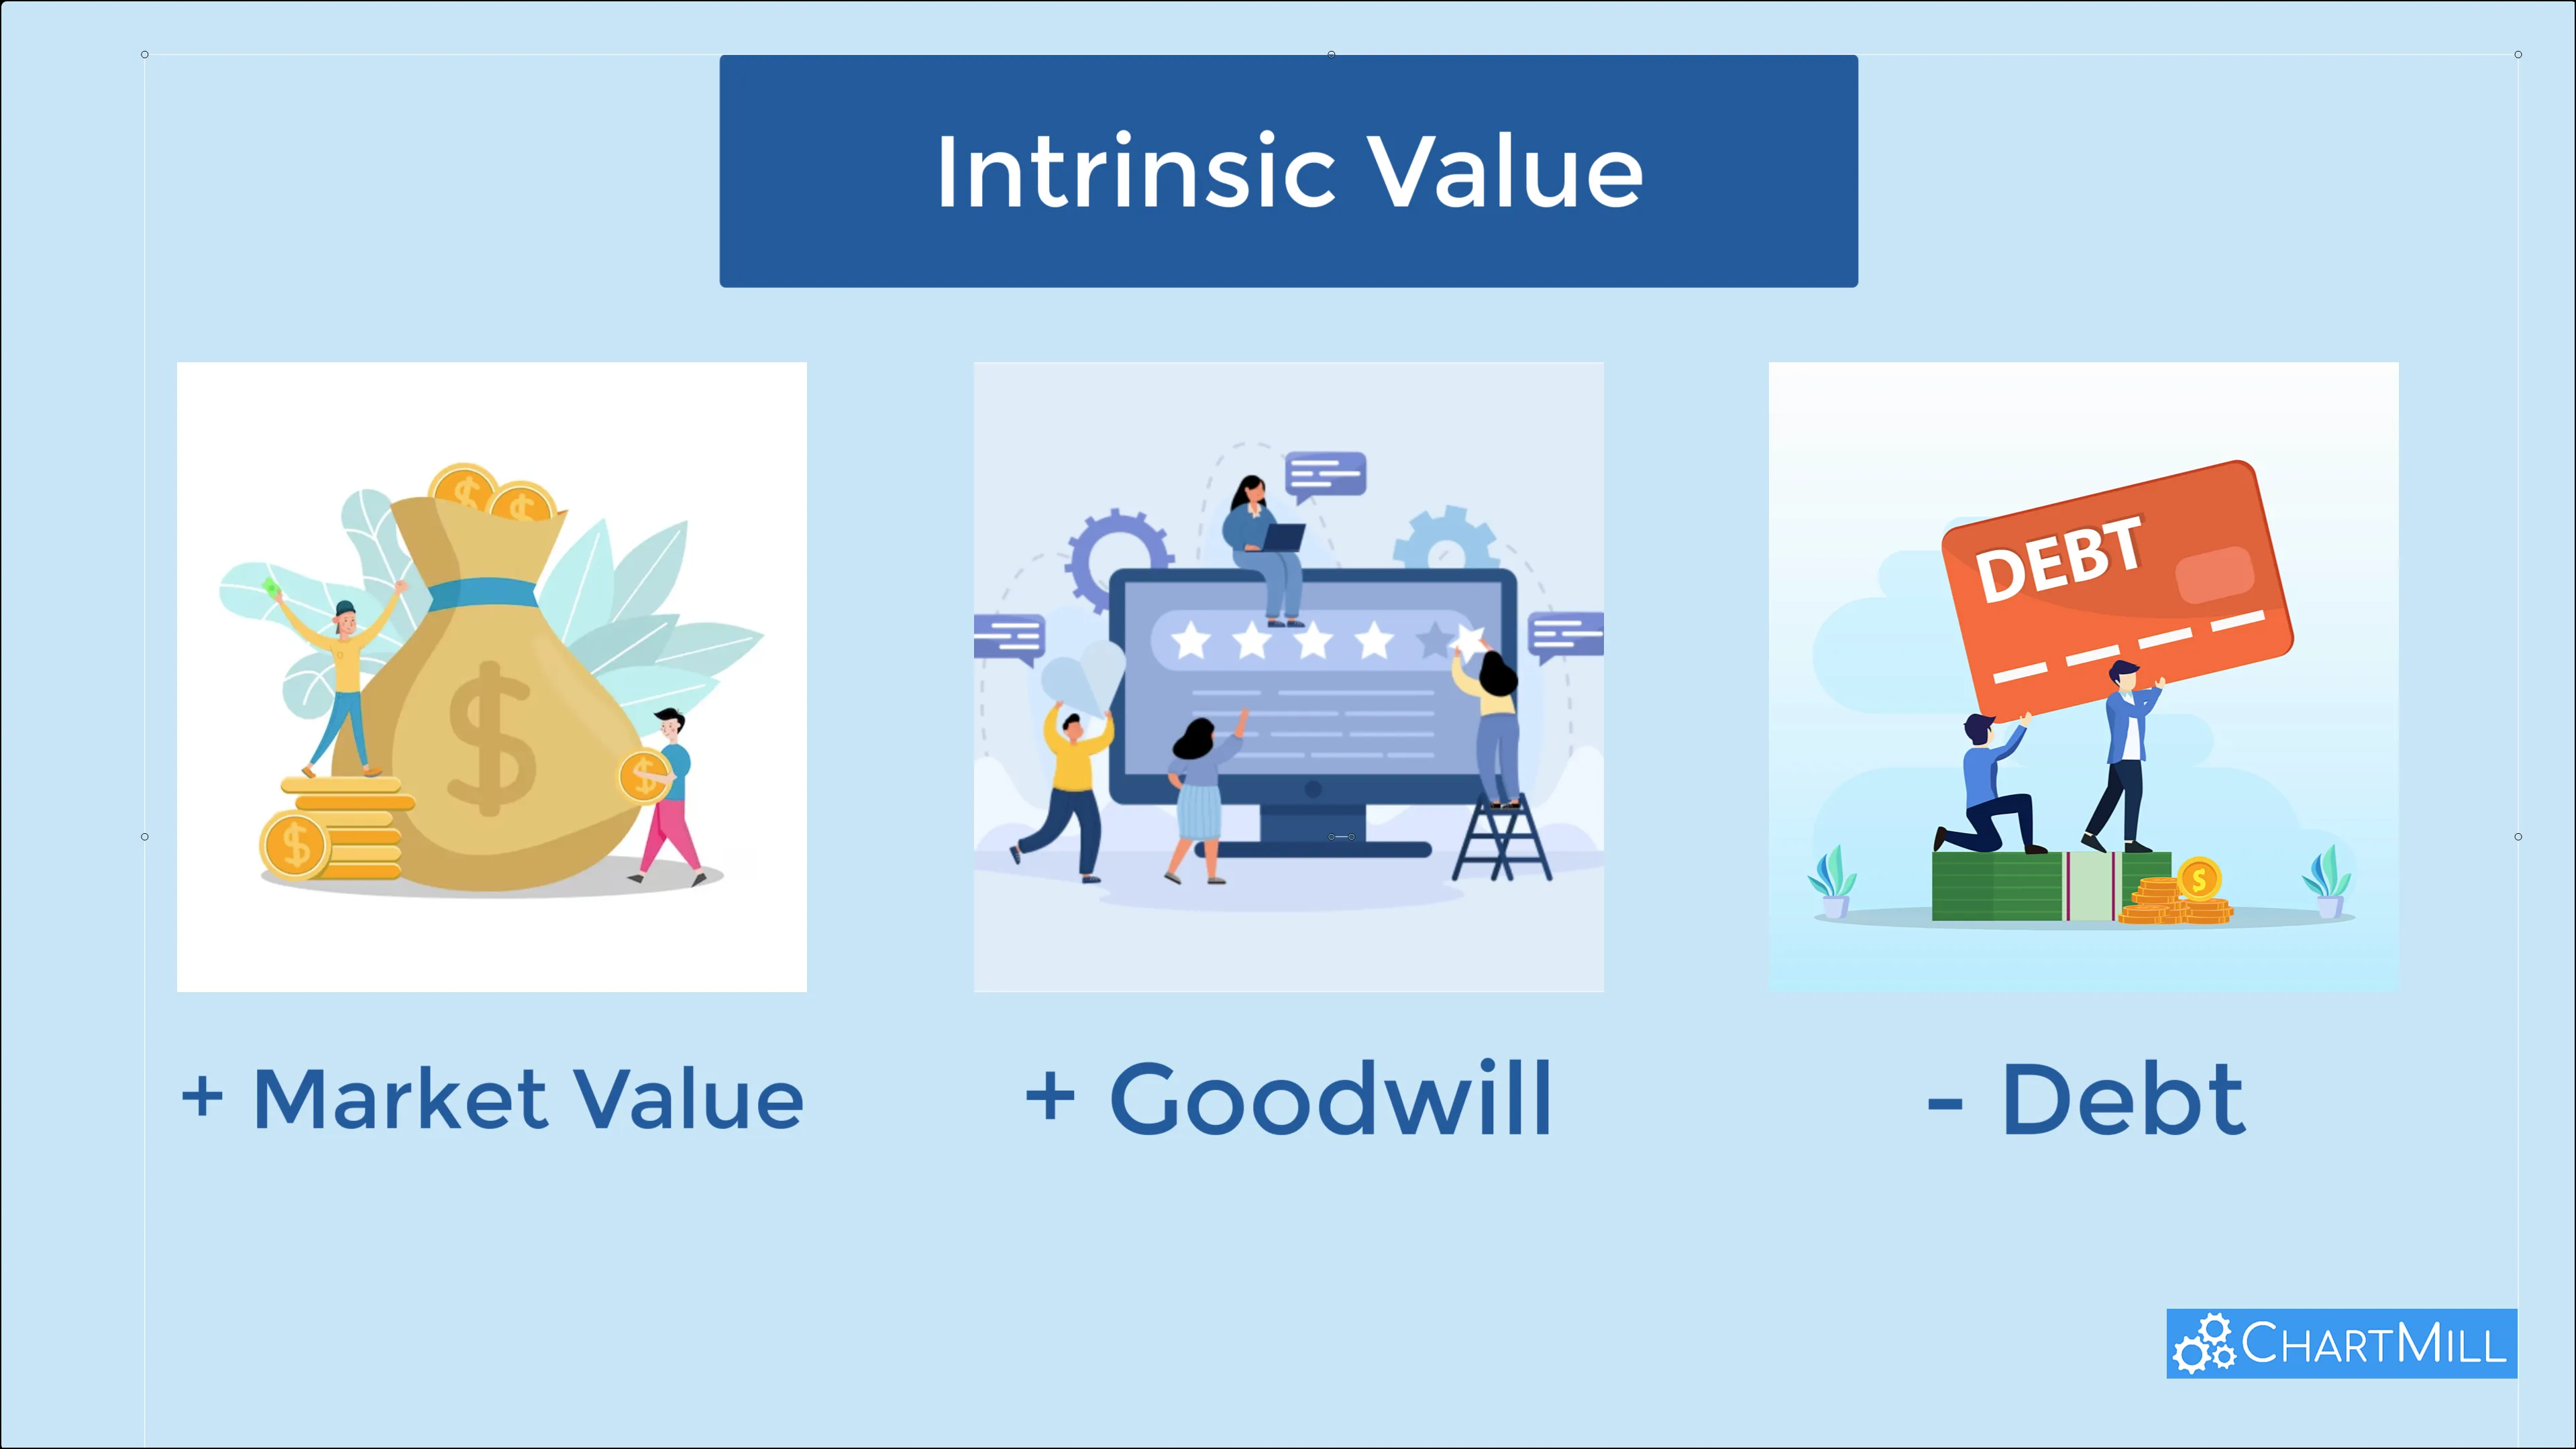
Goodwill refers mainly to intangible assets (customer portfolio, licenses, patents, experience of staff, etc.).
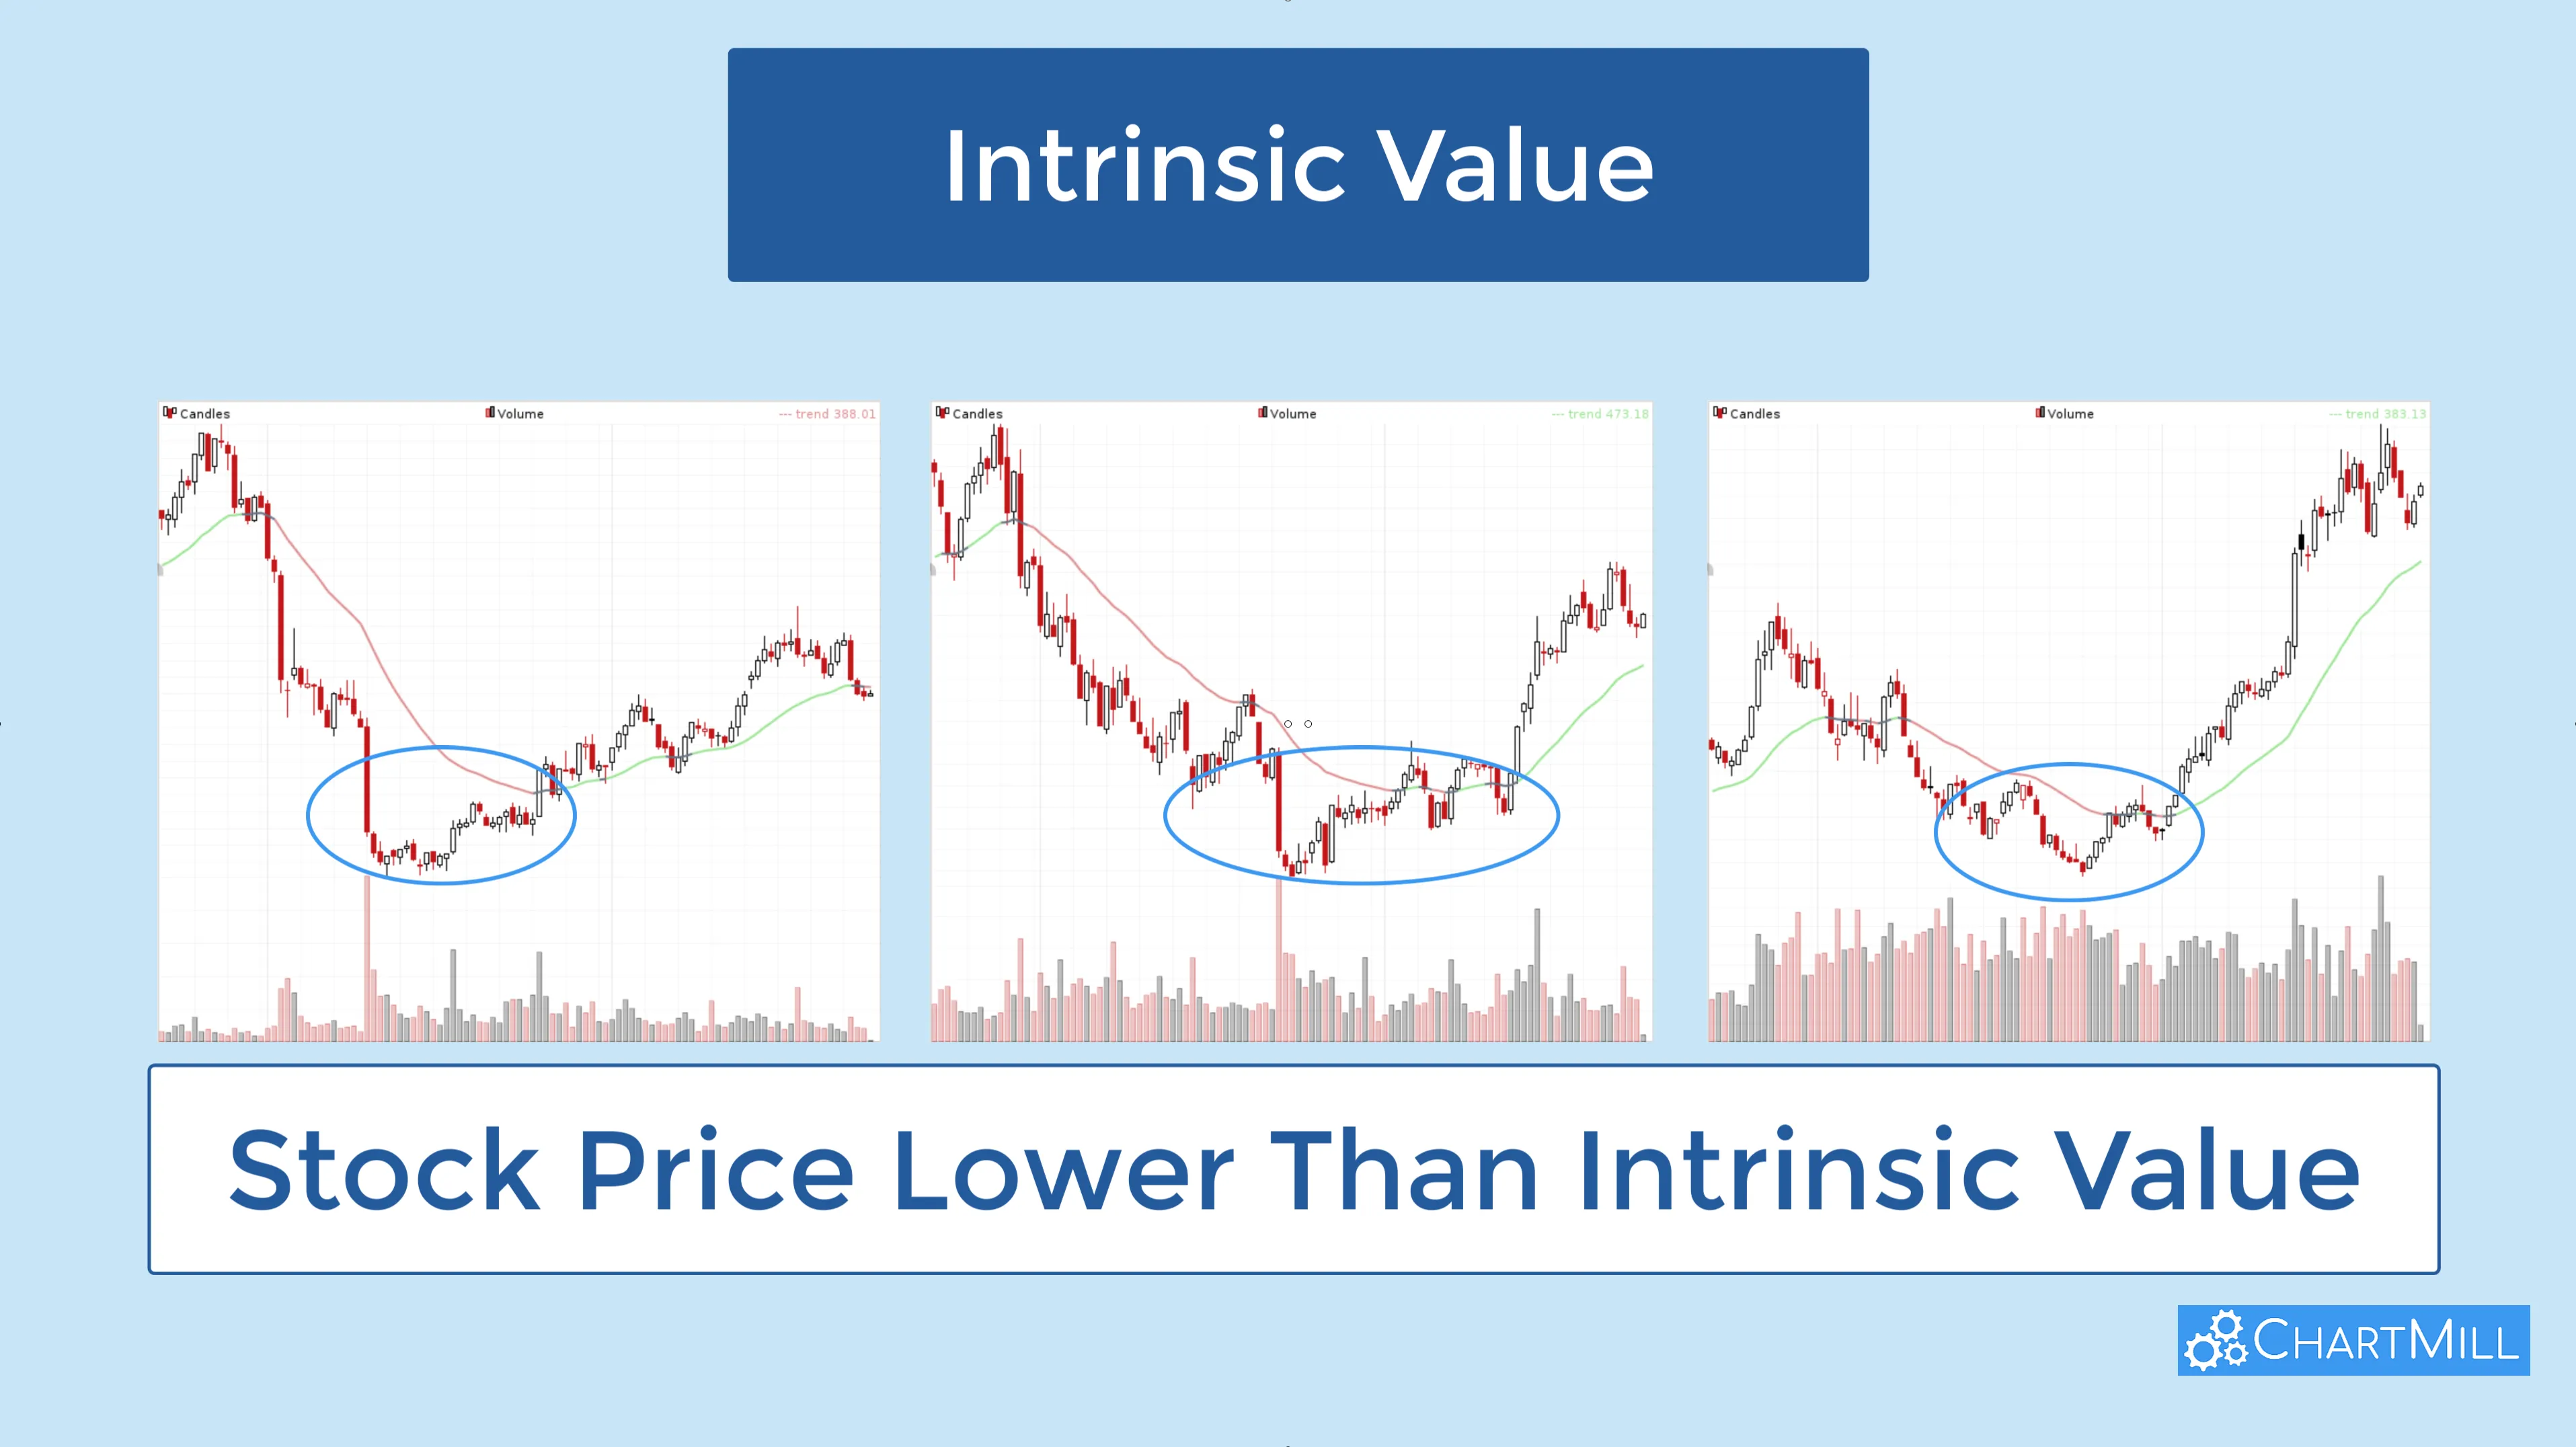
Basically, for these stocks, there is a plausible chance that the price will rise again toward the real value.
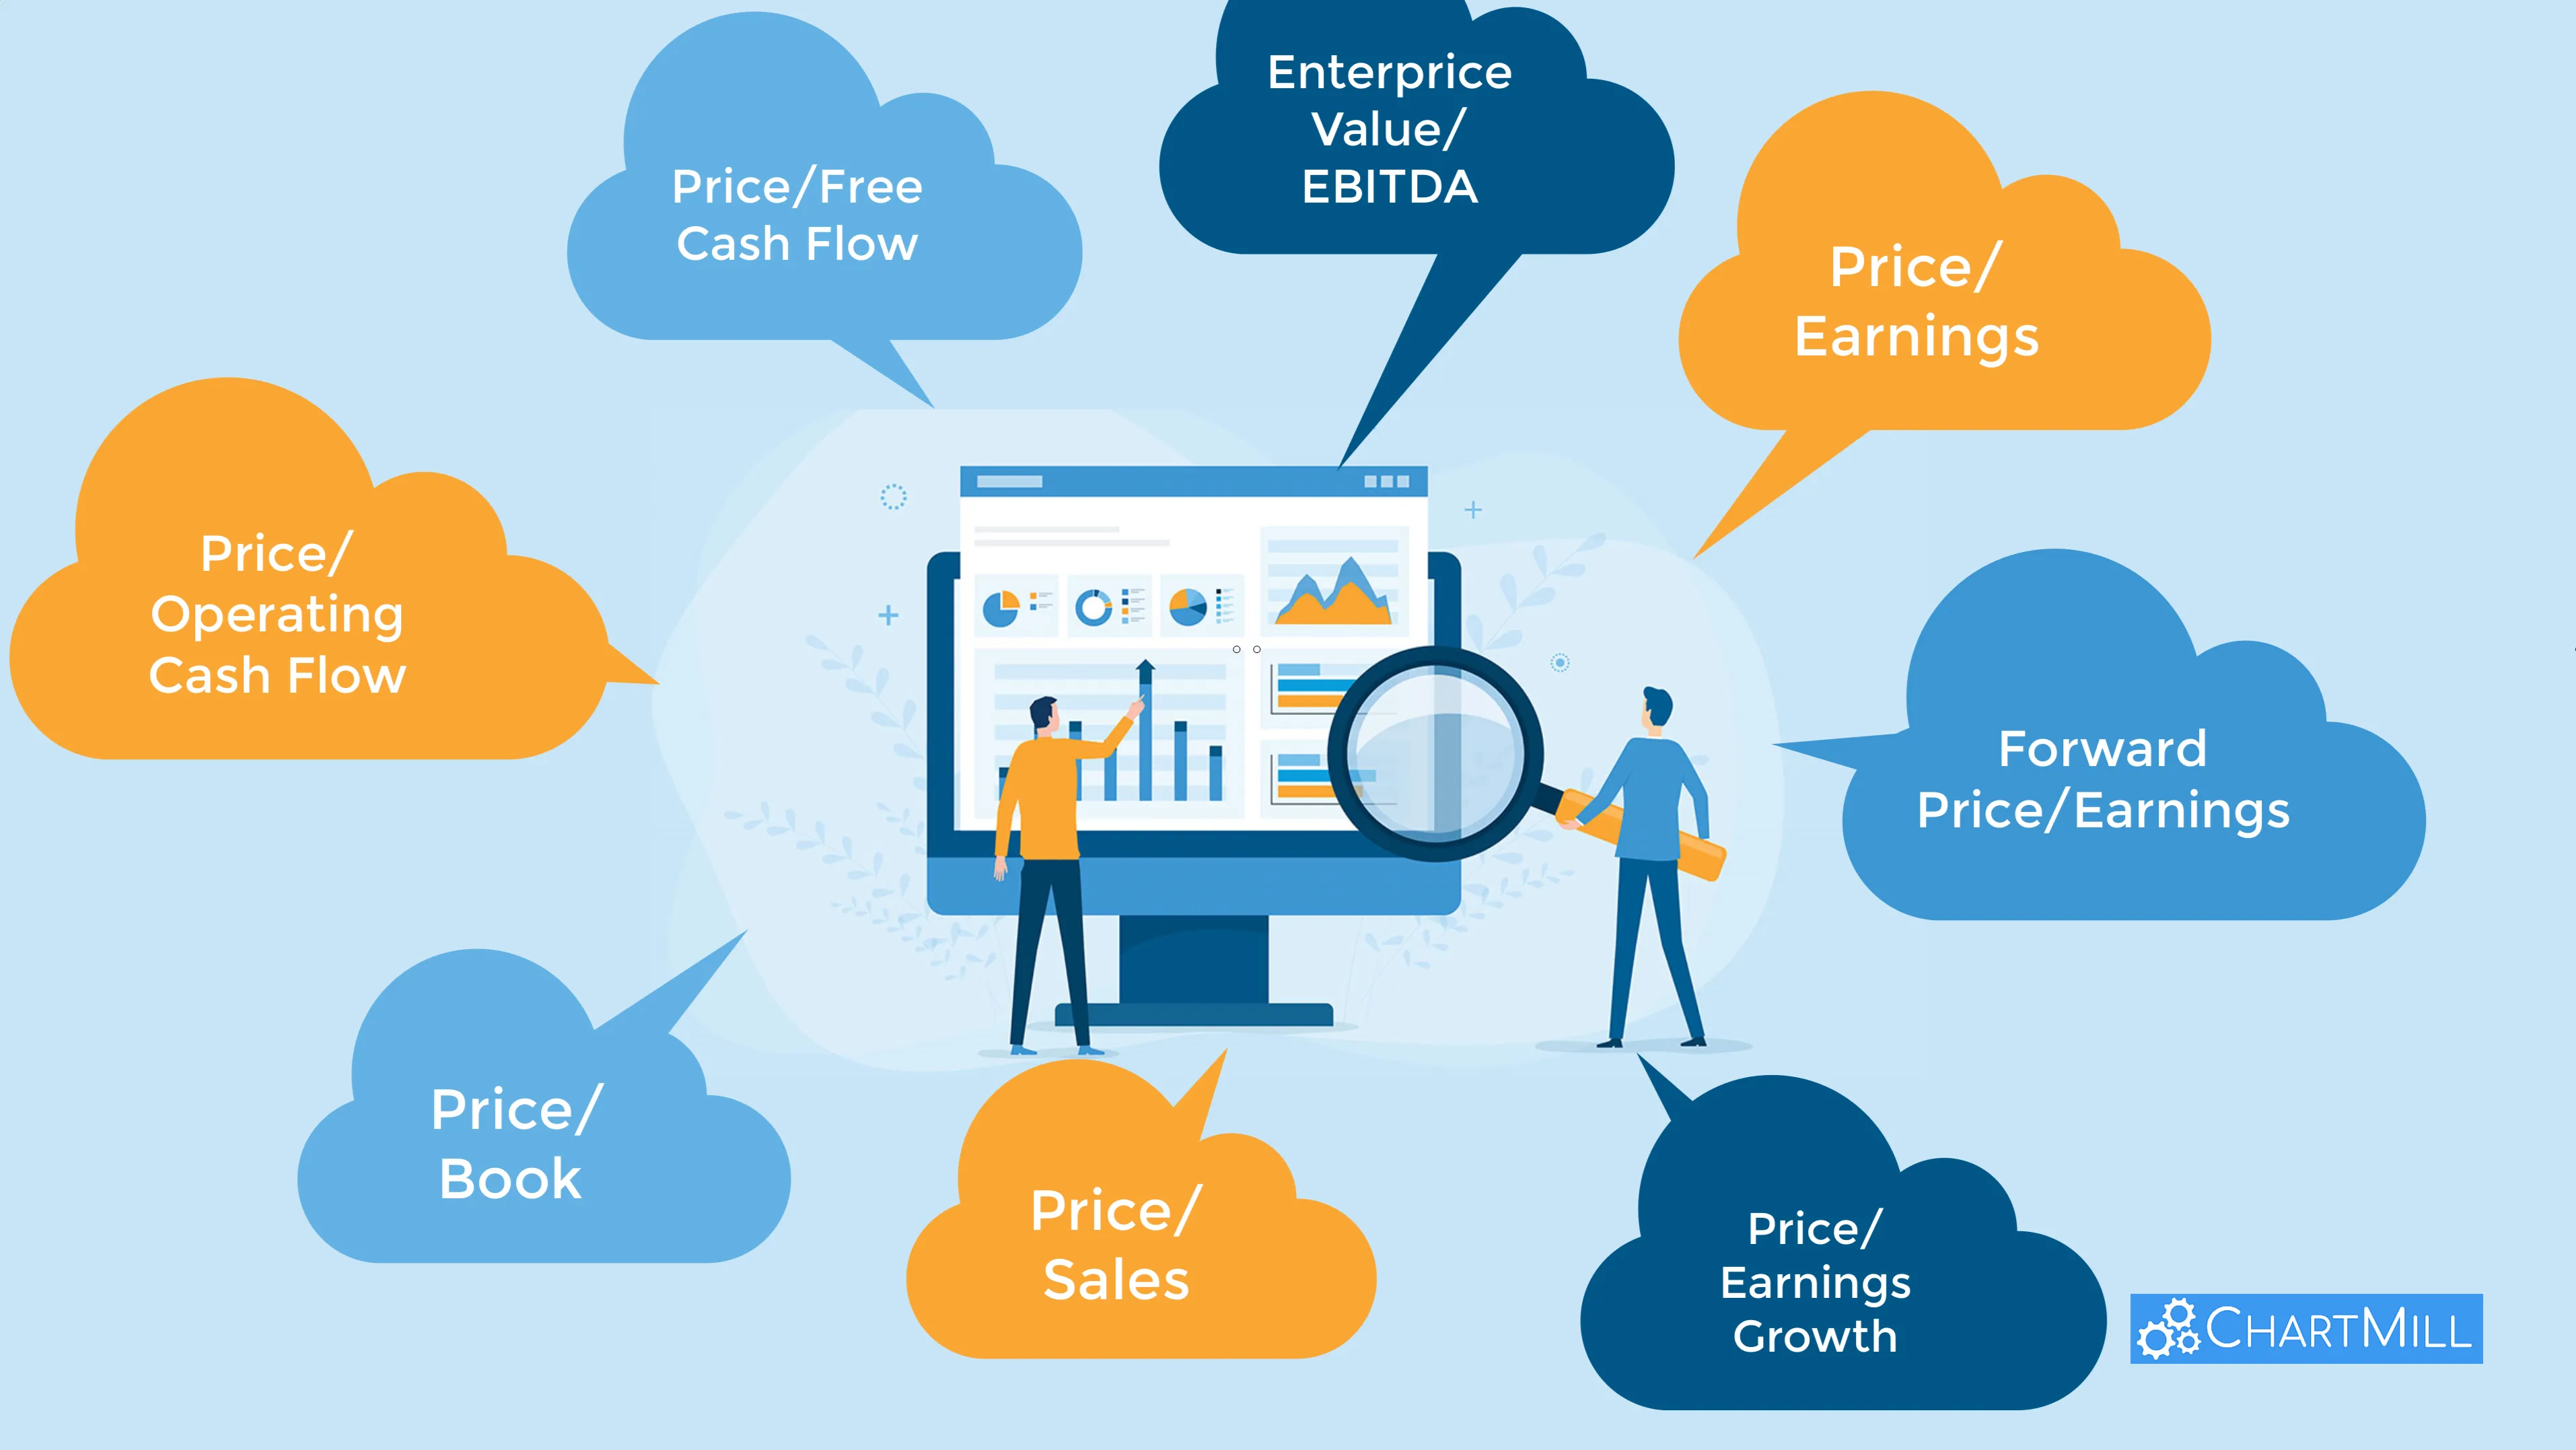
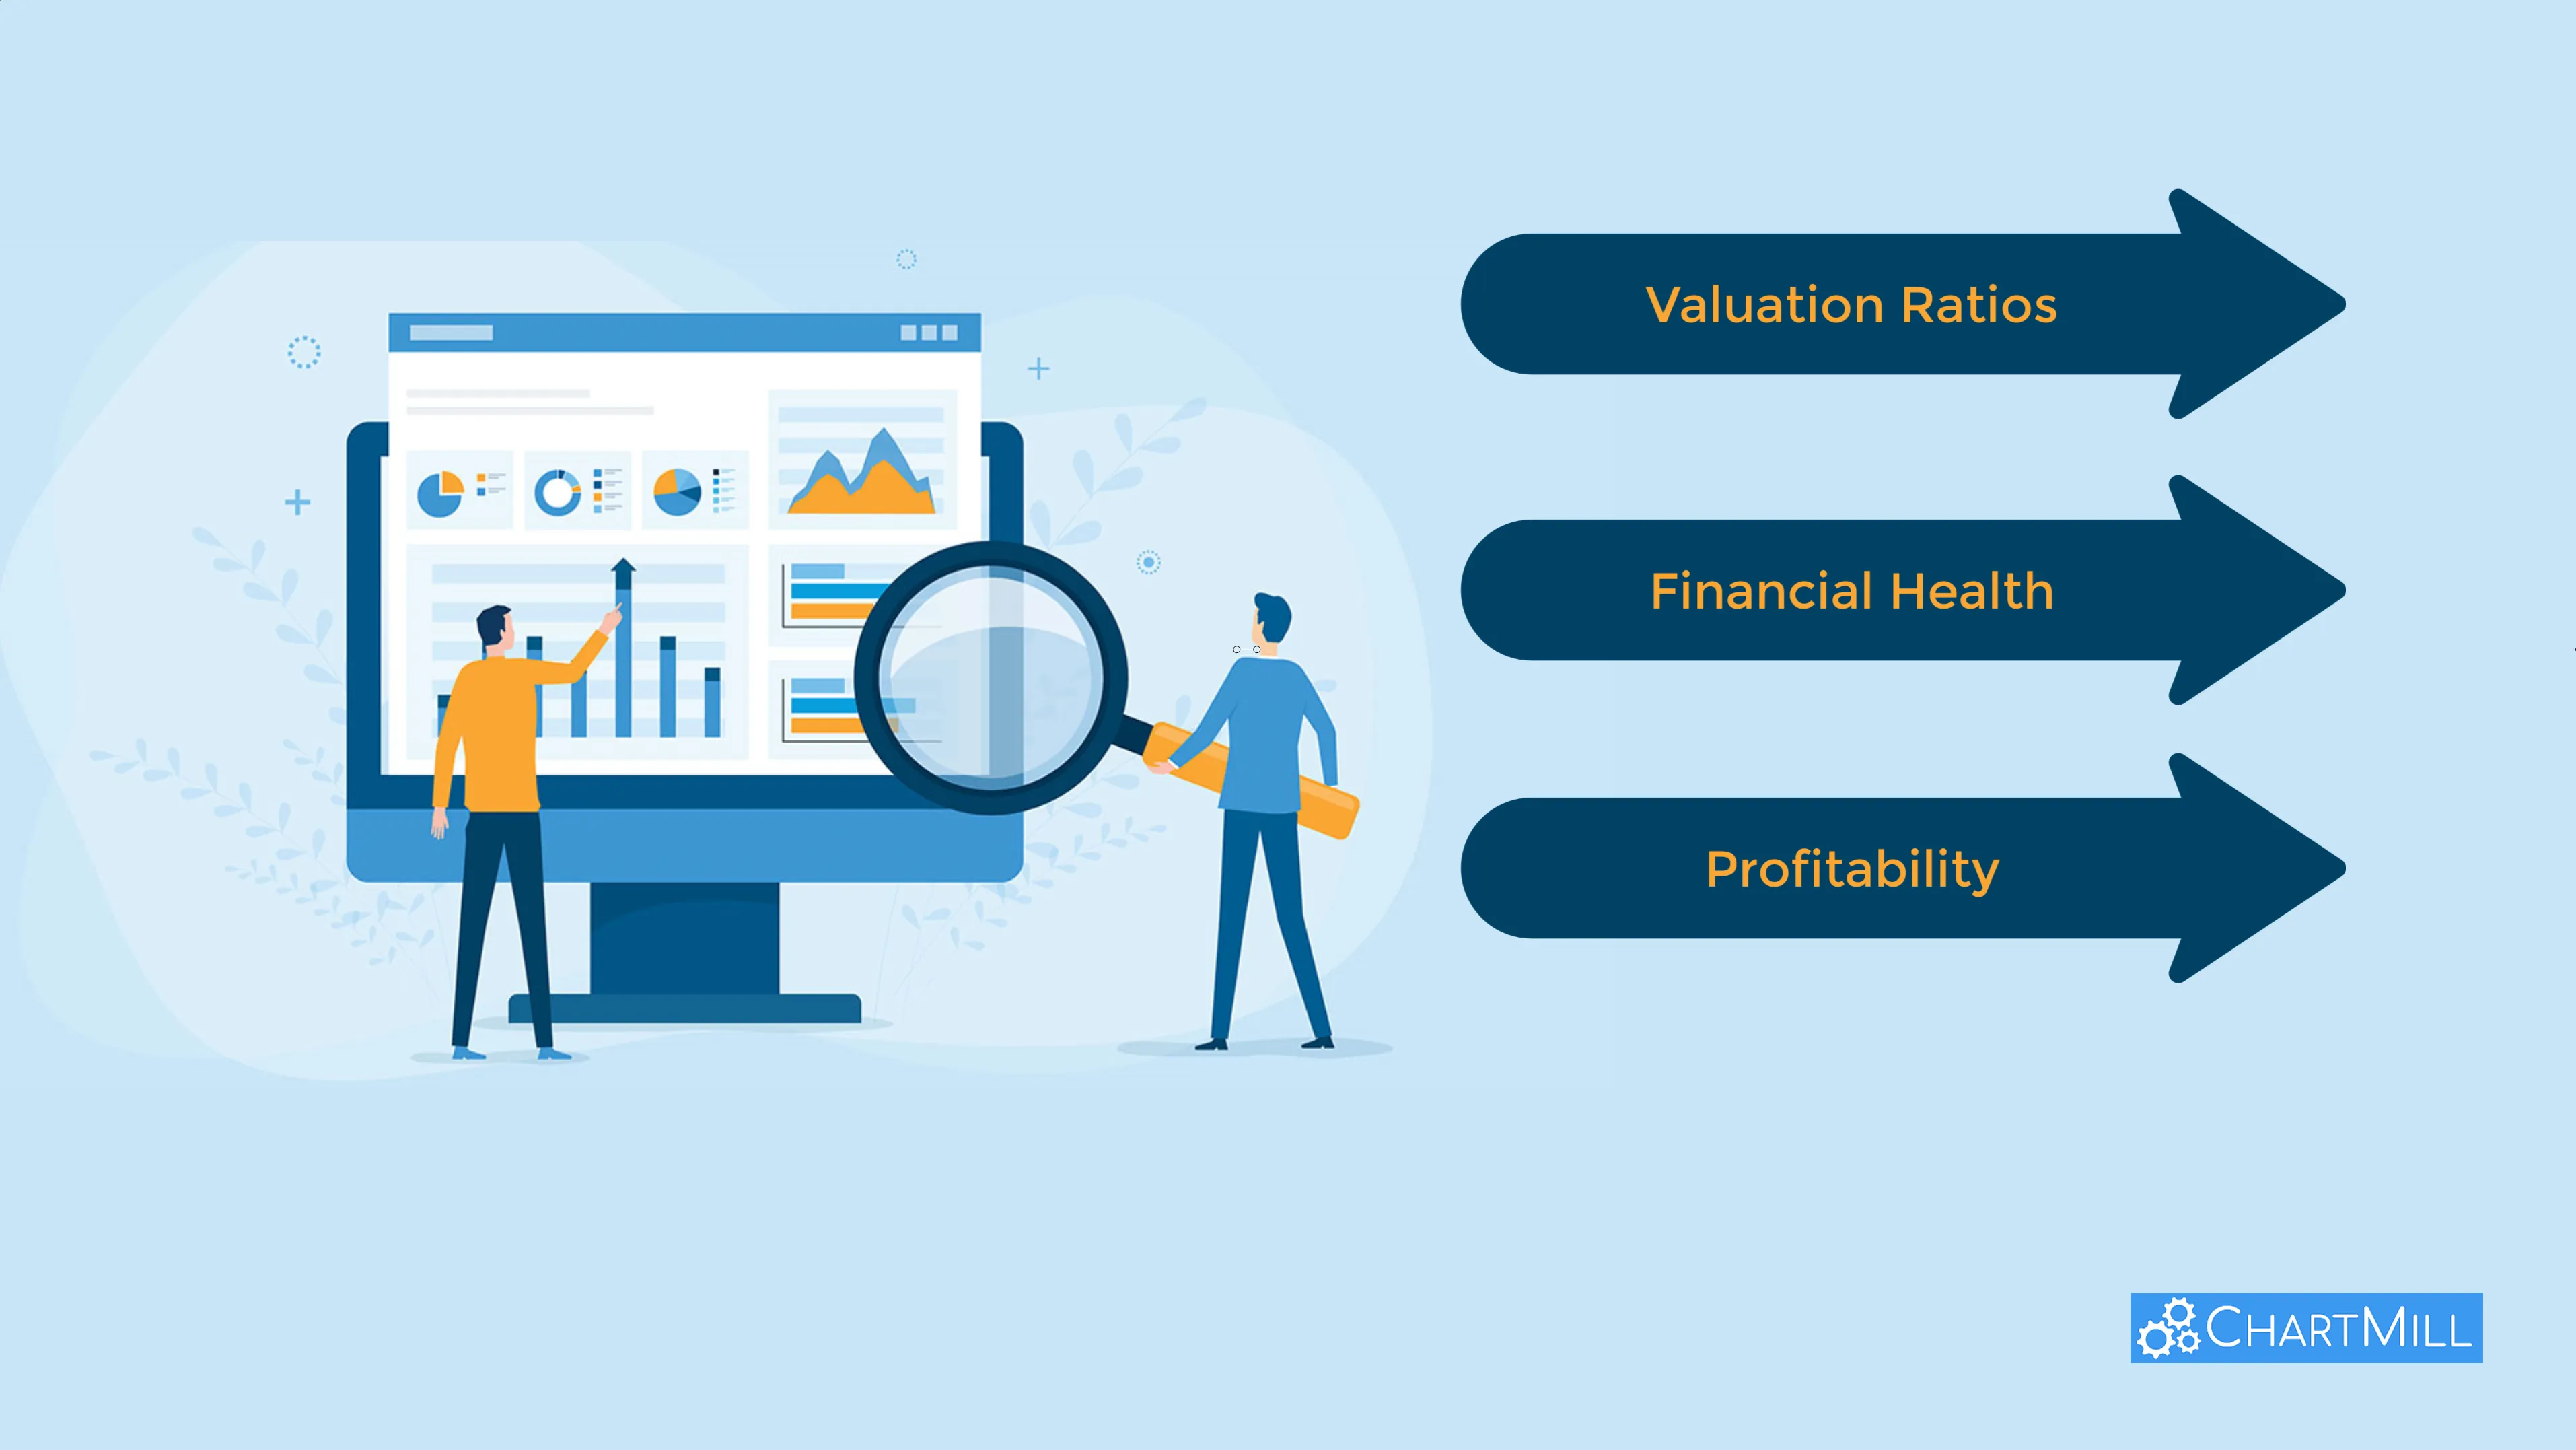
List of fundamental ratios that provide insight into a company's valuation.
To determine whether or not a company is under- or overvalued, the first step is to examine several specific valuation metrics.
P/E - Price/Earnings
This ratio measures the price investors are willing to pay for every dollar of profit the company generates. A high P/E ratio may indicate an overvalued stock, while a low ratio may indicate undervaluation.
Forward P/E
This is a variation of the traditional P/E ratio that looks at a company's expected future earnings rather than past earnings.
PEG - Price Earnings Growth
An extension of the ordinary P/E ratio that also takes into account expected earnings growth. Useful for understanding valuation versus growth prospects.
P/S - Price/Sales
The price-to-sales ratio assesses a company's stock price relative to sales per share. This is useful for evaluating companies with low or negative earnings.
P/B - Price/Book
The P/B ratio compares the market value of a company's stock to its book value (the company's intrinsic value). A ratio lower than 1 may indicate an undervalued stock.
P/OCF - Price/Operating Cash Flow
This ratio evaluates a company's stock price relative to its cash flow from operations. It provides insight into a company's ability to generate cash.
P/FCF - Price/Free Cash Flow
The price-to-free cash flow ratio evaluates a company's stock price relative to its ability to generate free cash flow, which can be used for growth, debt repayment, or returning value to shareholders.
EV/EBITDA - Enterprise Value/Earnings before interest, taxes, depreciation, and amortization
Is a measure of a company's total value, including debt and equity. It is often used to compare the valuation of different companies, especially in acquisitions and mergers.
Mind you, these are only valuation ratios. You should also pay attention to the financial health of the company and to what extent the company is sufficiently profitable.
Applying multiple screening filters will ensure that you are left with a list of companies that are worth investigating and analyzing further.
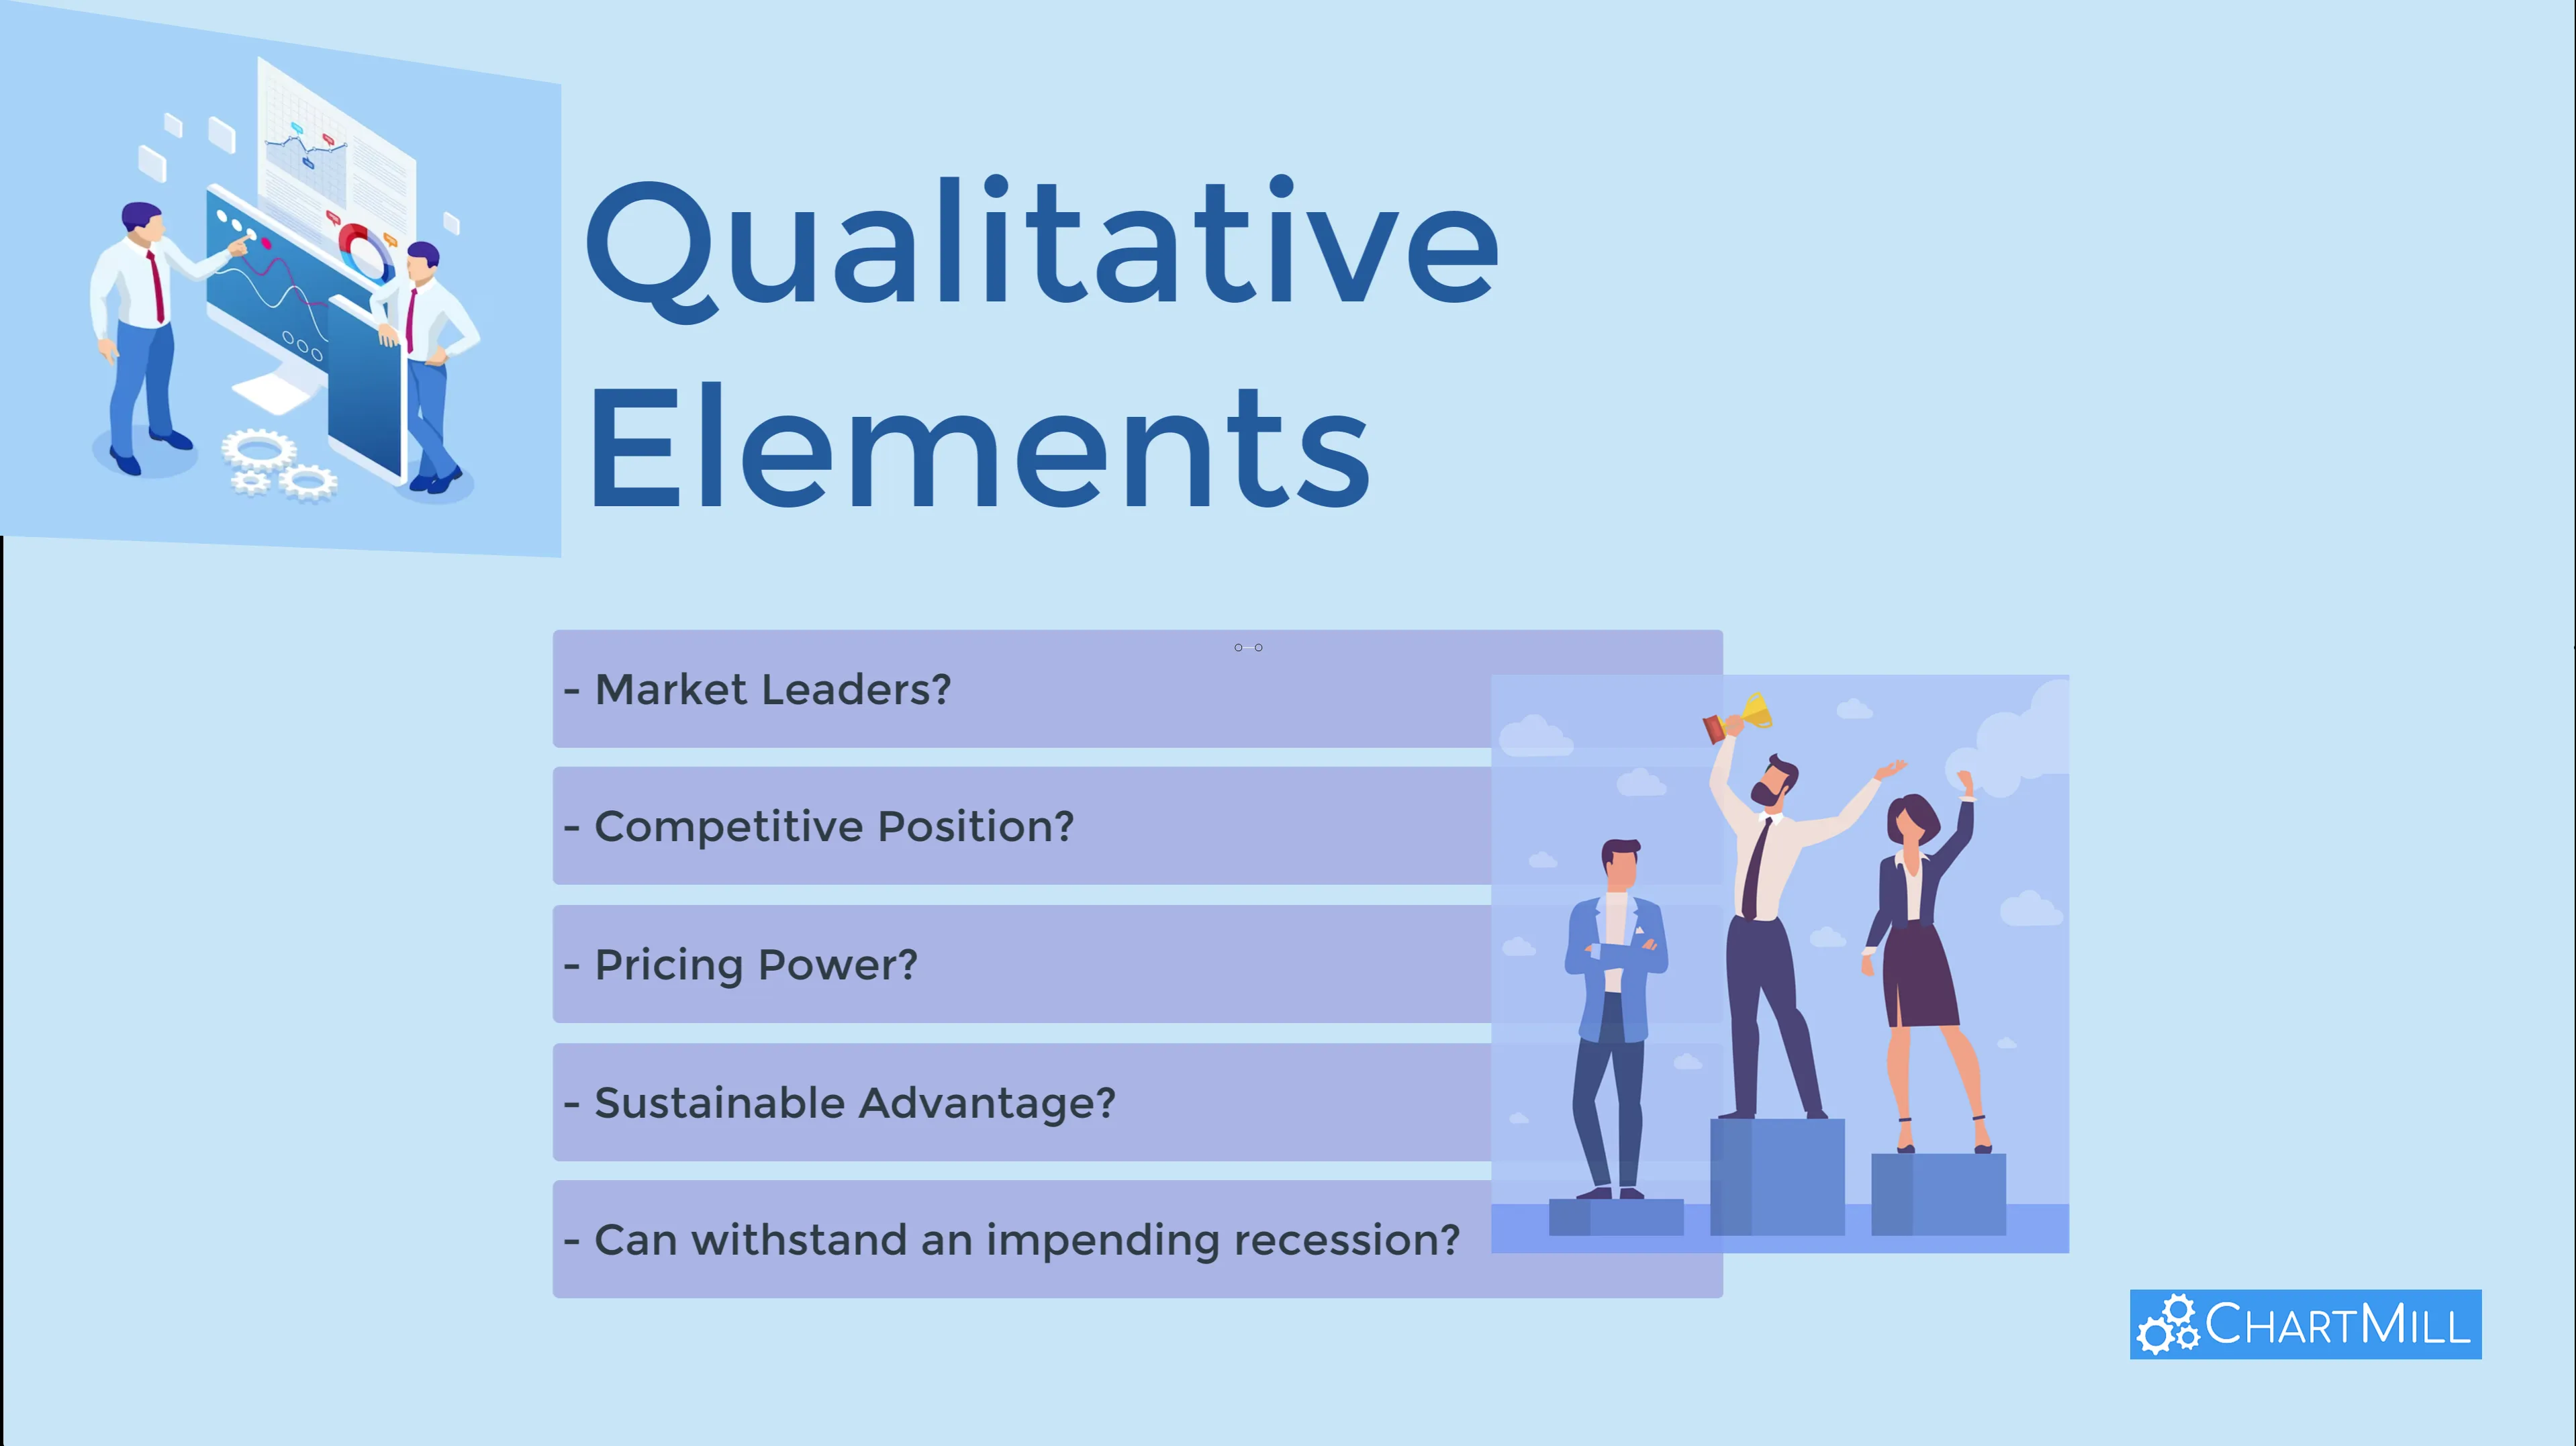
Next, it comes down to examining the qualitative elements in more detail:
- Who are the true market leaders?
- What is the competitive position between them?
- Which companies possess pricing power or a sustainable competitive advantage?
- Which companies are best able to withstand a flagging economy... etc.
The real winners will be the companies that, despite the negative market sentiment and the temporary slump in prices, continue to score well both quantitatively and qualitatively.
Using The ChartMill Stock Screener To Spot Good Value Stocks
Option 1: ChartMill Ratings
ChartMill ratings are without a doubt the easiest and fastest way to find undervalued stocks. In this process, the software itself examines the valuation ratios after which a score is determined from 1 to 10.
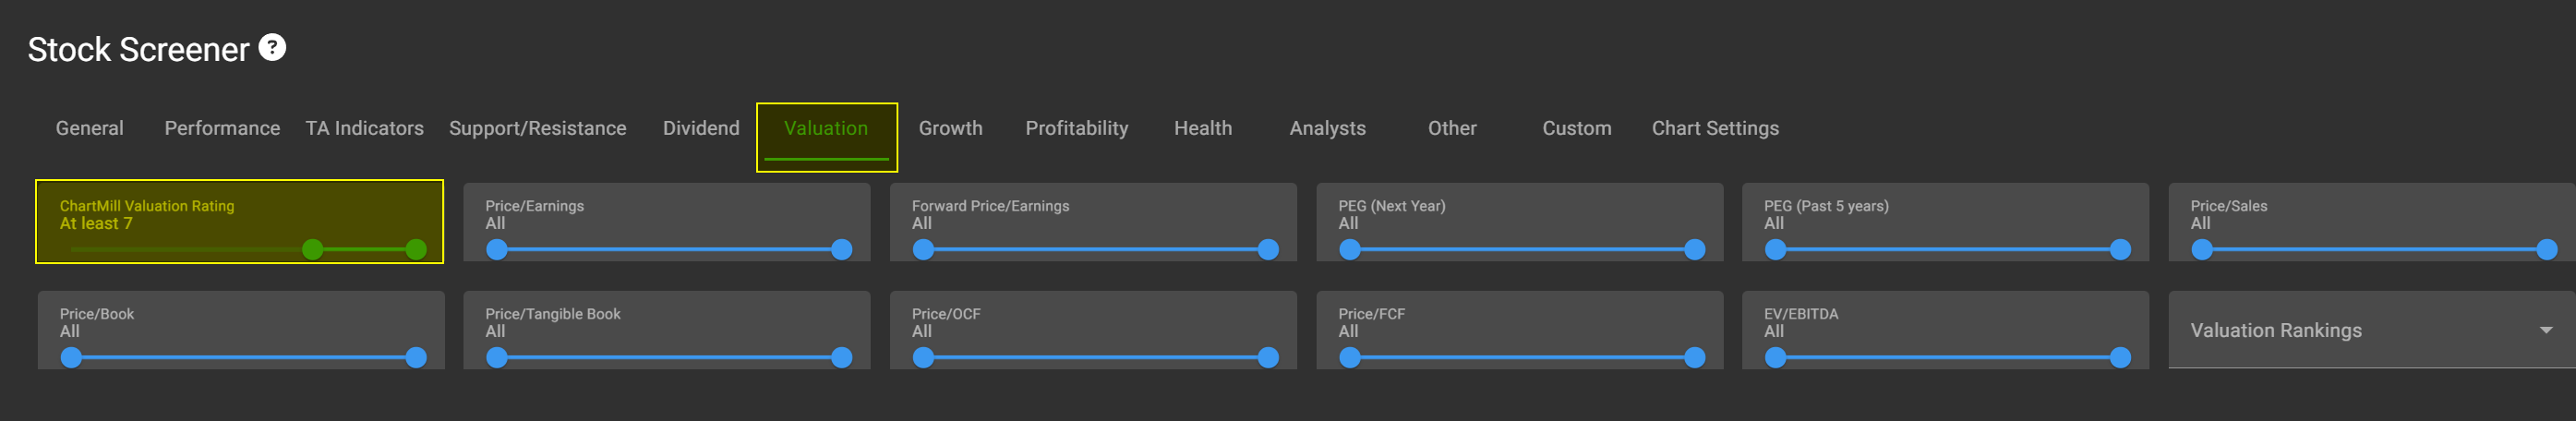
Go to the stock screener page and click on the valuation tab. At the top left, you will see the ChartMill Valuation Rating slider. Slide it from left to right and set it to the desired value. Since we are specifically looking for typical value stocks, we use a minimum of 7/10.
We are not using the ChartMill rating for growth in this case. After all, we are primarily looking for profitable companies with a strong track record (and preferably priced as cheaply as possible). Typical for such companies is that their growth potential is rather limited.
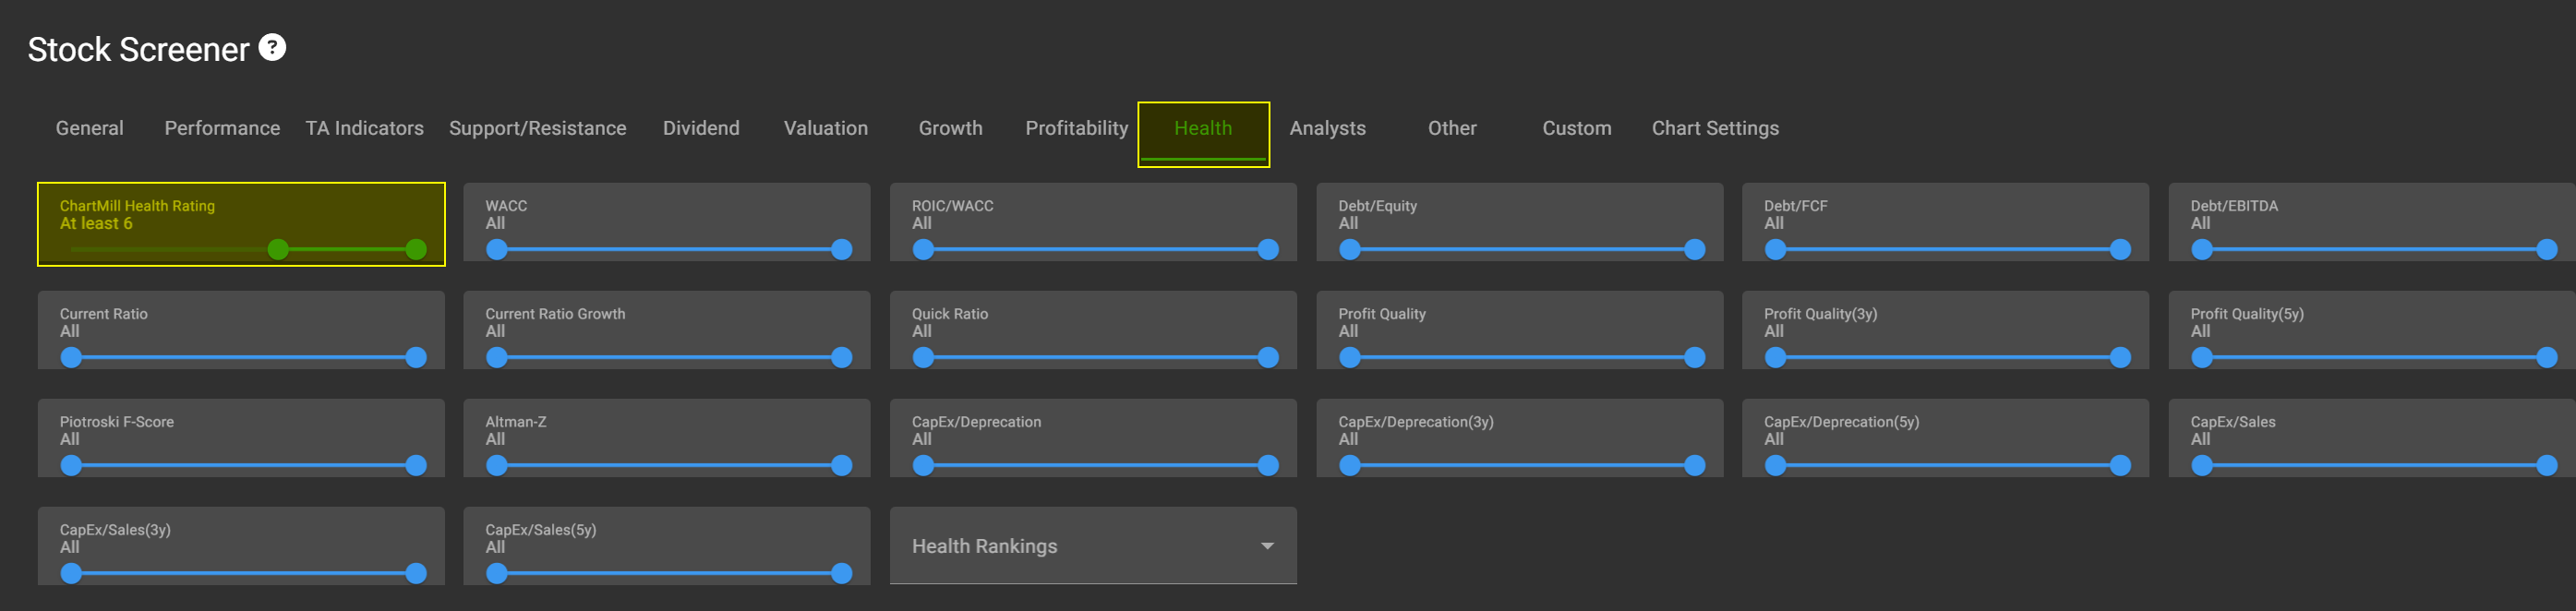
Of course, companies should have a healthy financial base. Open the financial health tab and set the score to 6/10.
Finally, select the profitability tab and set the rating to at least 6/10.
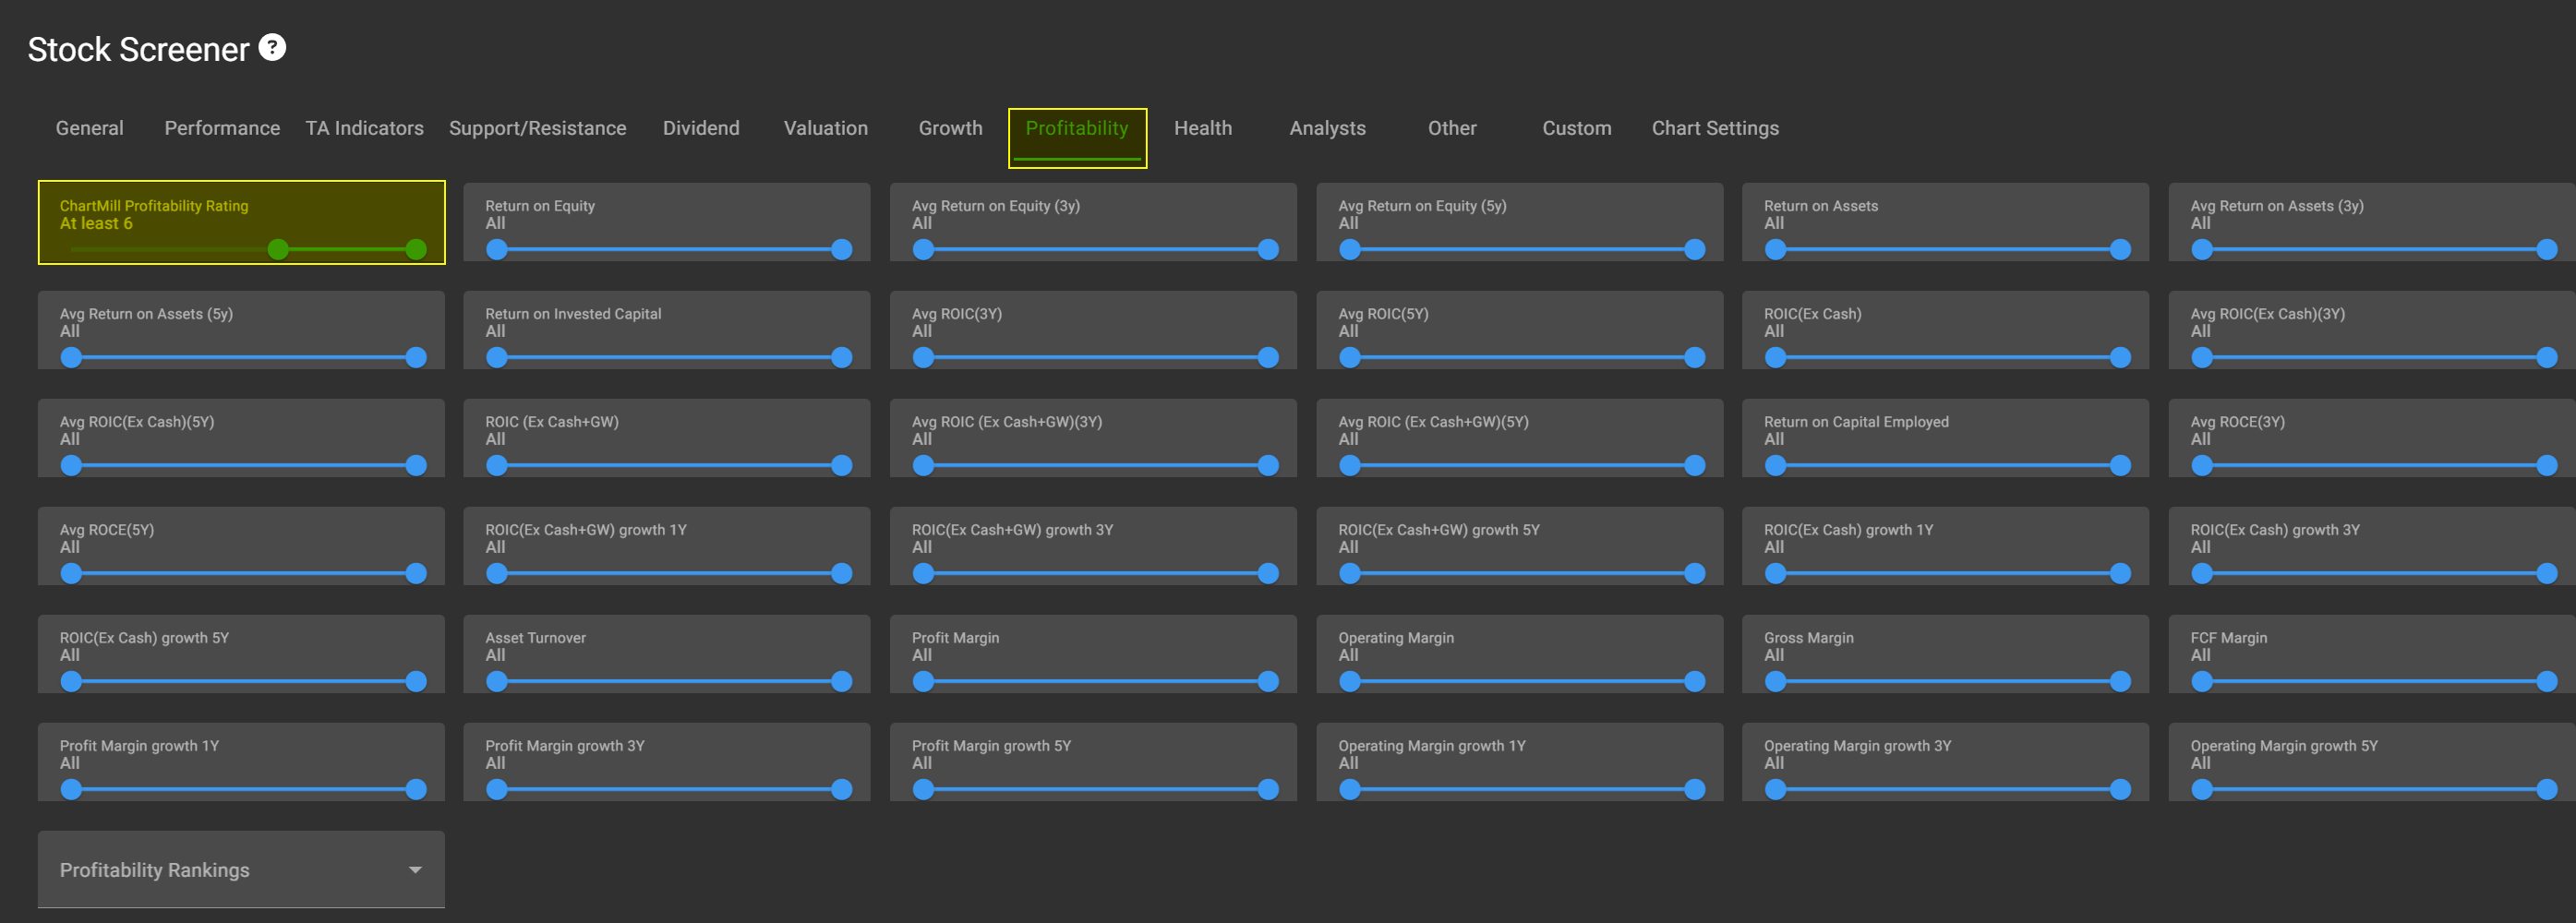
If dividends are important to you, you can also set a rating for the dividend filter. However, keep in mind that you might filter out stocks that may be very attractive purely in terms of valuation. We would recommend not using this filter as a basis.
This way, in just a few clicks, you get a basic overall list of companies that are currently potentially undervalued.
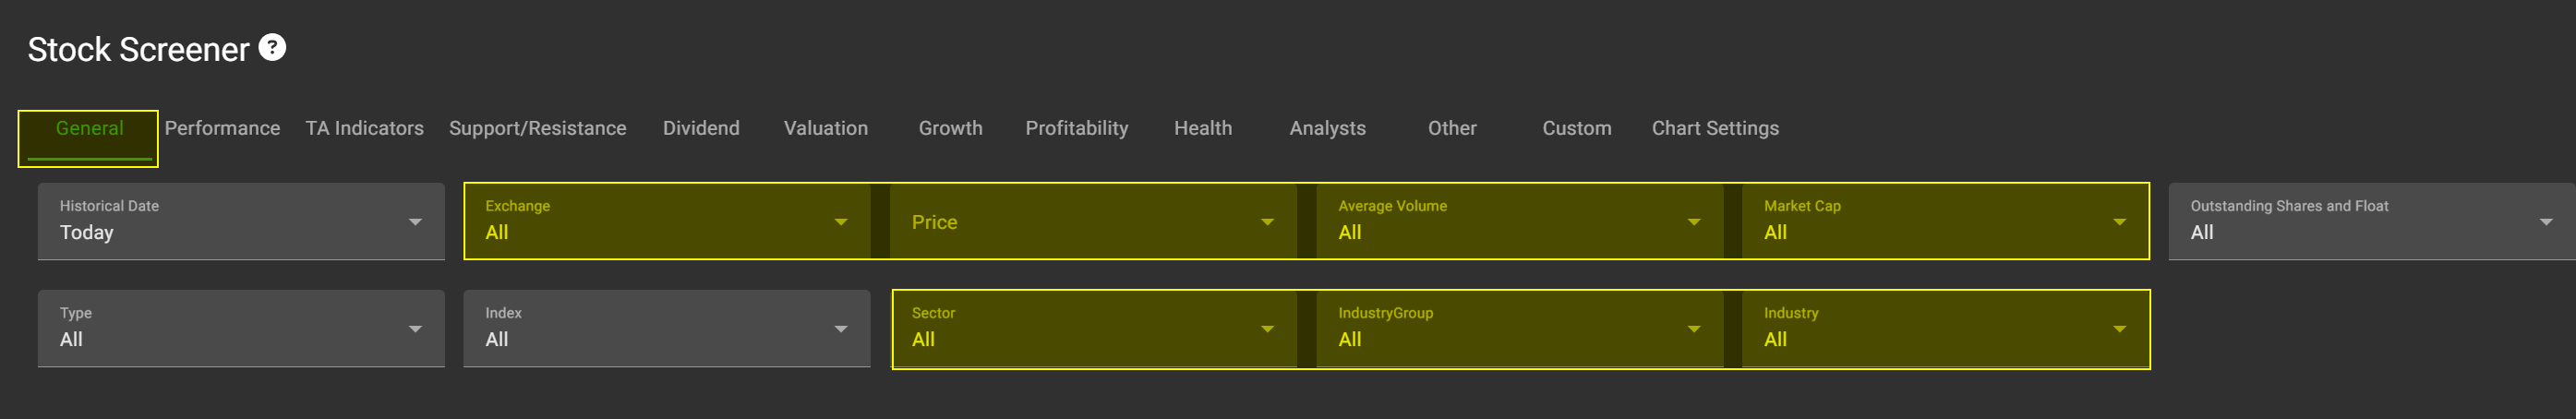
You can easily further refine this list with other filters. For example, you can limit the search to U.S. stocks only, set a minimum price or volume, or require a specific market capitalization.
One of the most interesting filters is the ability to search within certain sectors, industry groups, or even specific industries. Especially when you want to compare companies from the basic list, this filter is necessary.
Option 2: ChartMill Trading Ideas
Trading ideas are another way to look for undervalued stocks.
Through the left main menu, click on the trading ideas section. On the next page you then select:
- Fundamental analysis only
- Value Investing
- ChartMill Screens Only
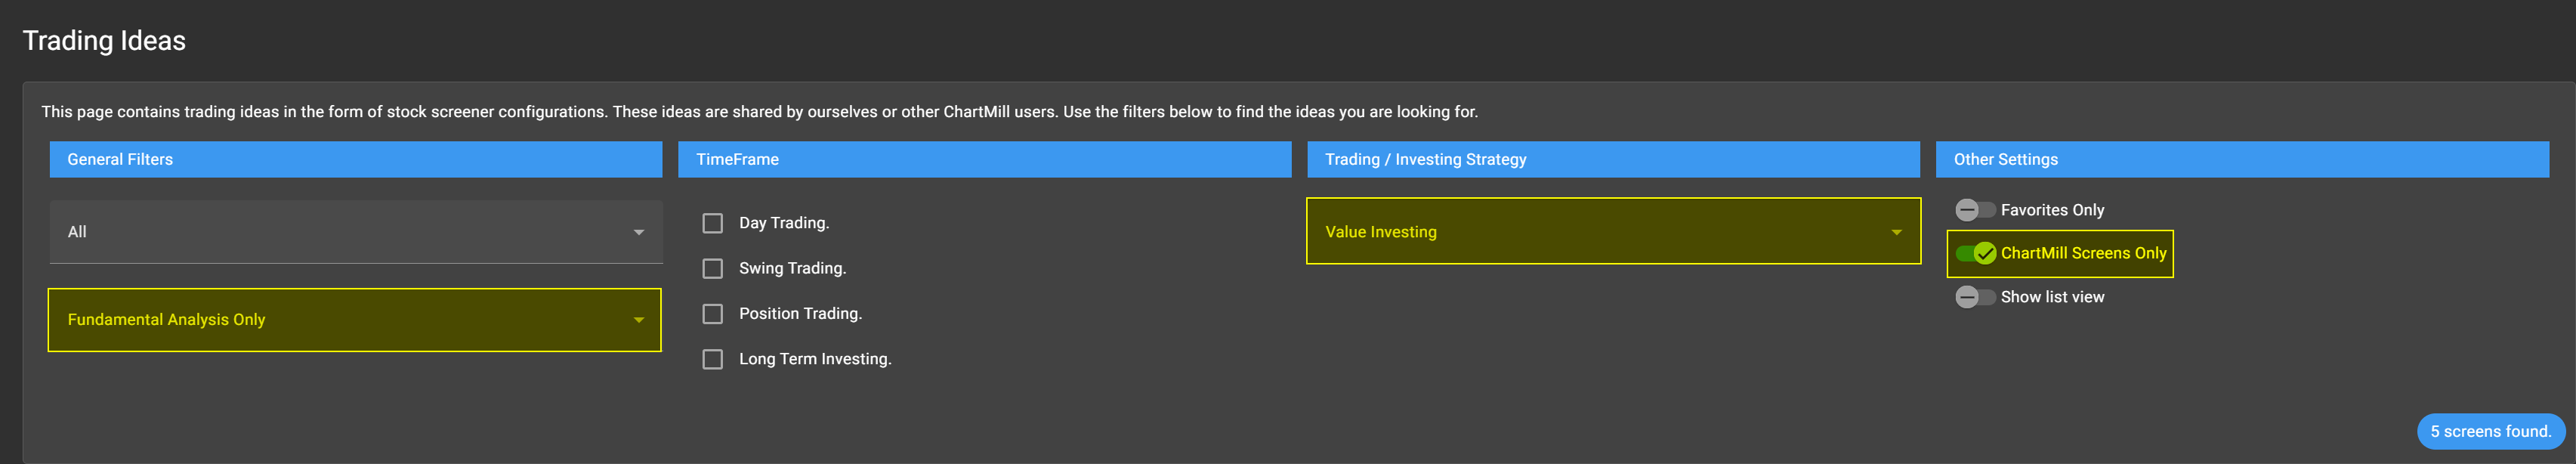
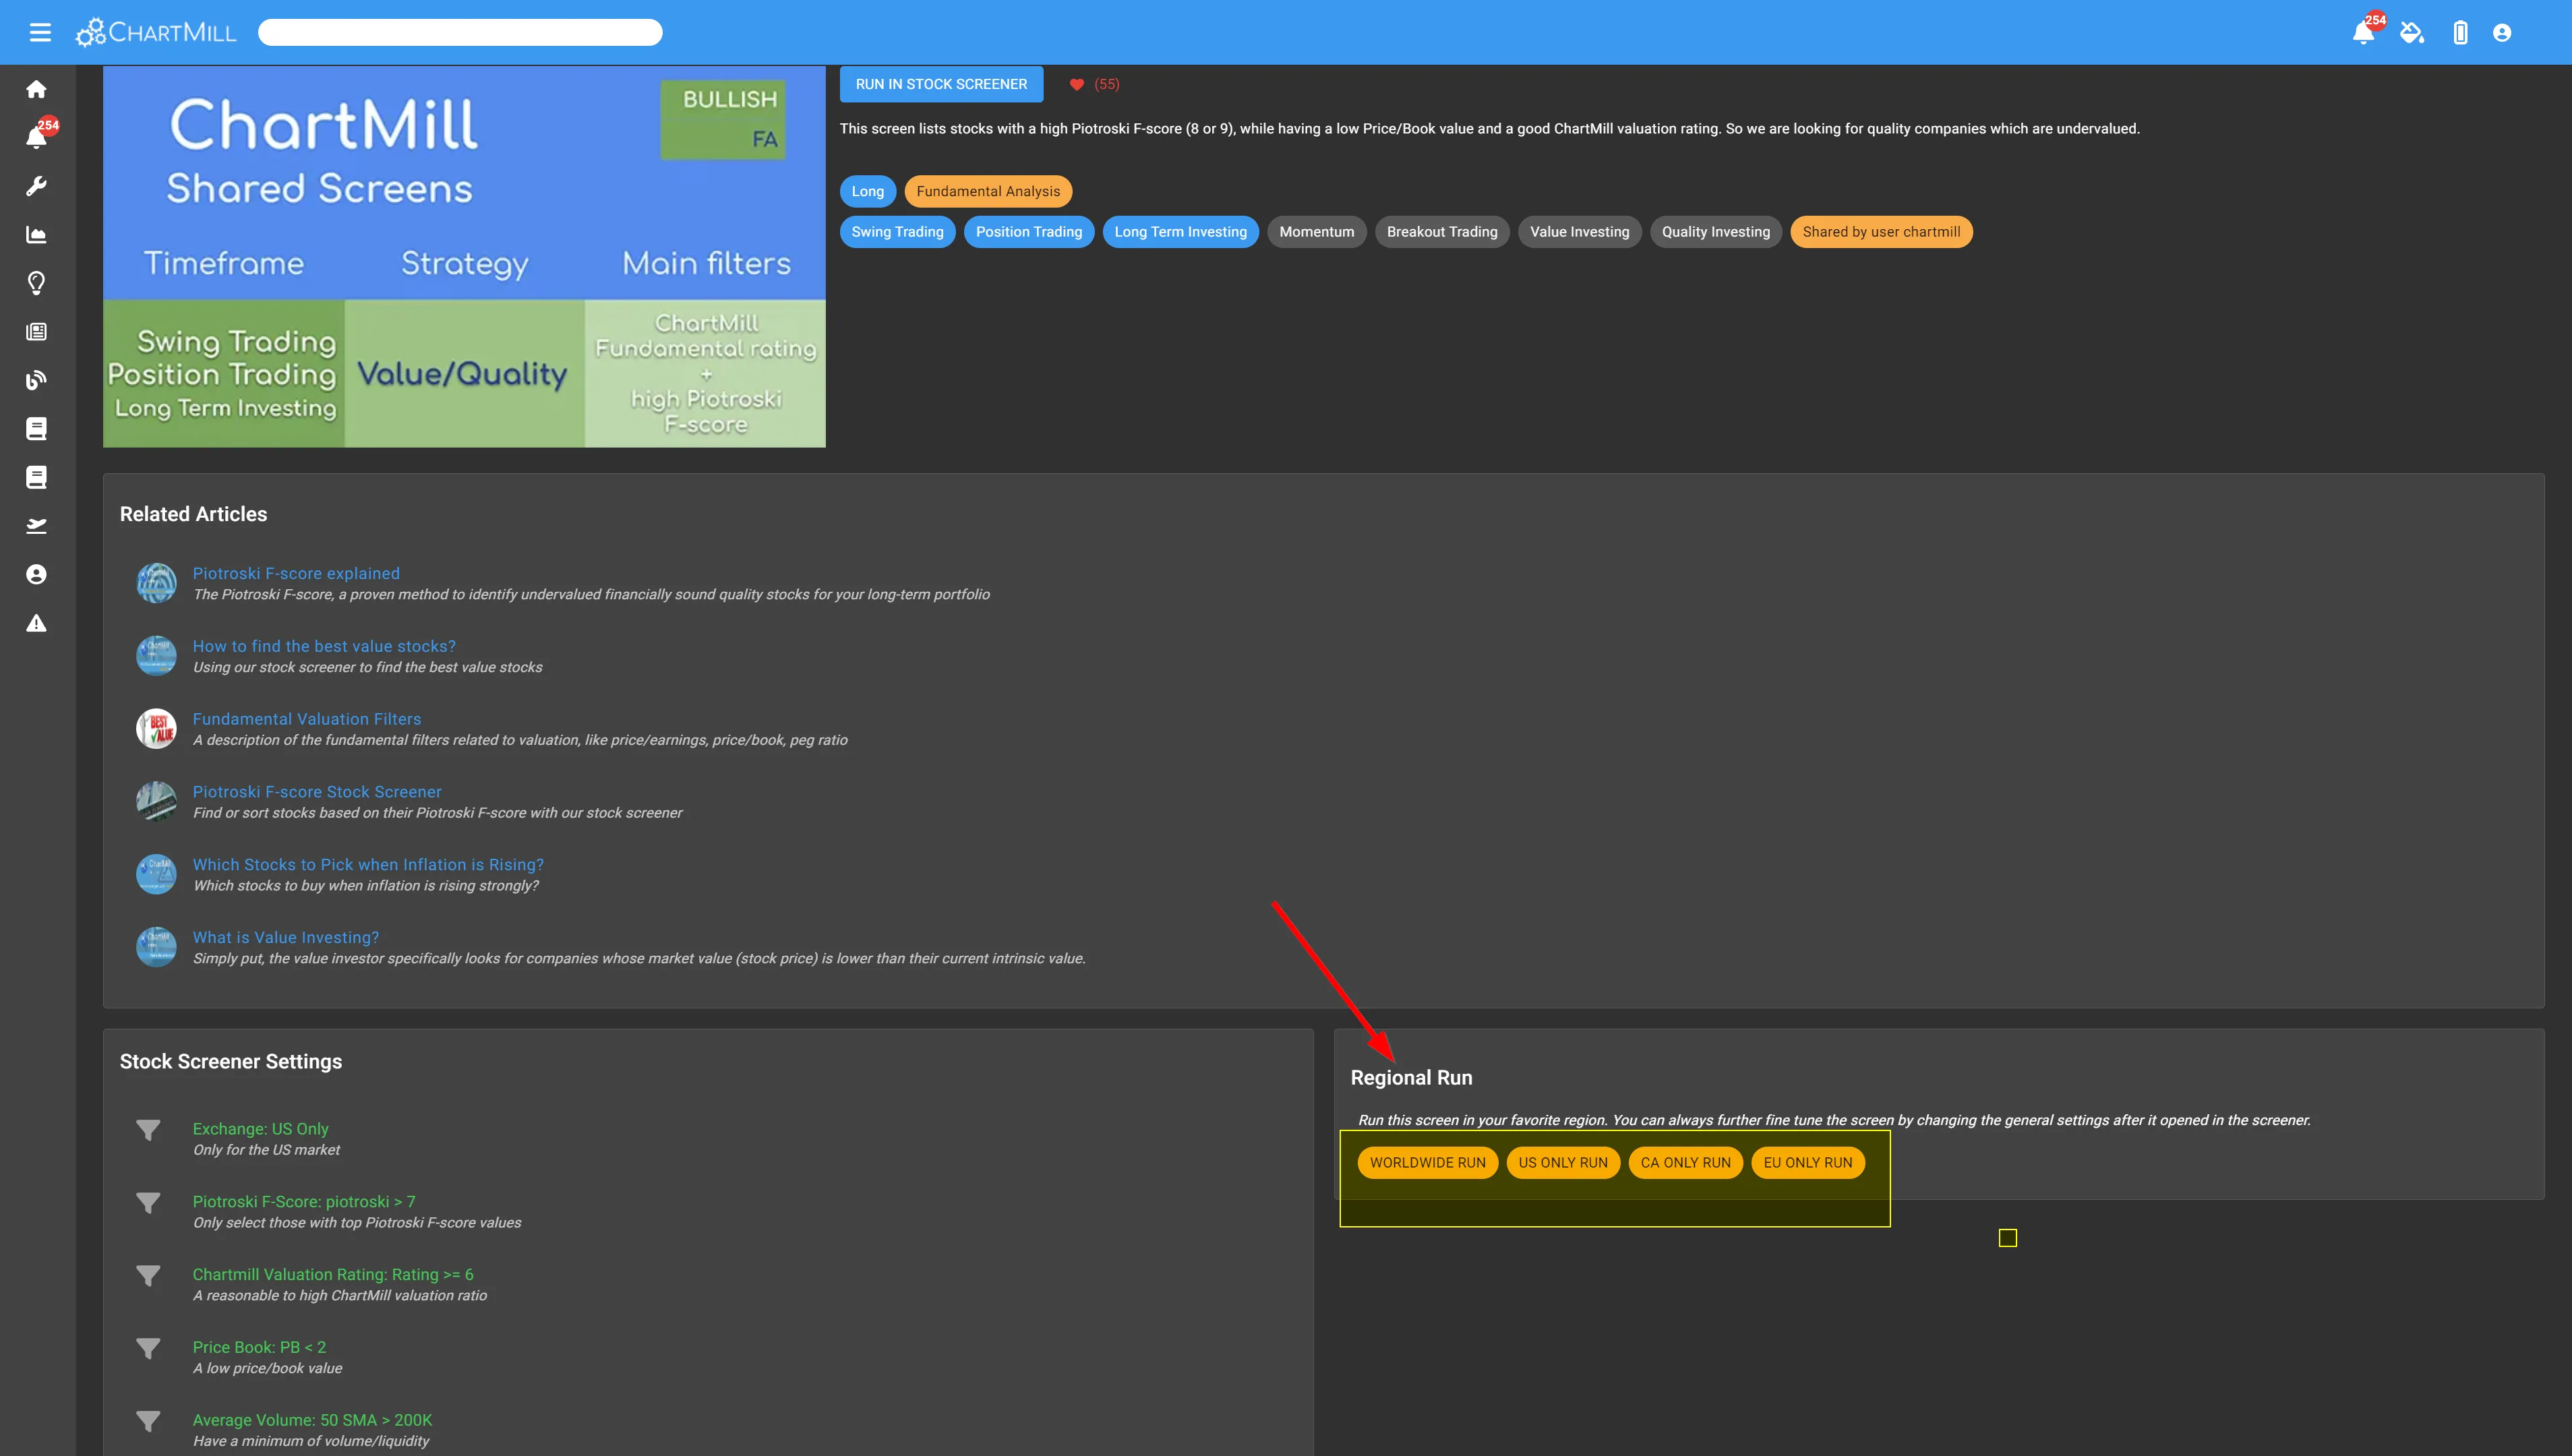
You'll get to see a number of screens that can serve as a starting point for value investors. Click on 'more info' to see detailed information about the parameters used for this screen.
On the next page, you can see the exact stock screener settings used.
Then click on the 'run' button and ChartMill immediately displays all stocks from the database that meet the parameters retained. The results are opened on the stock screener page making it possible to modify, remove, or add additional filters to the predefined filters.
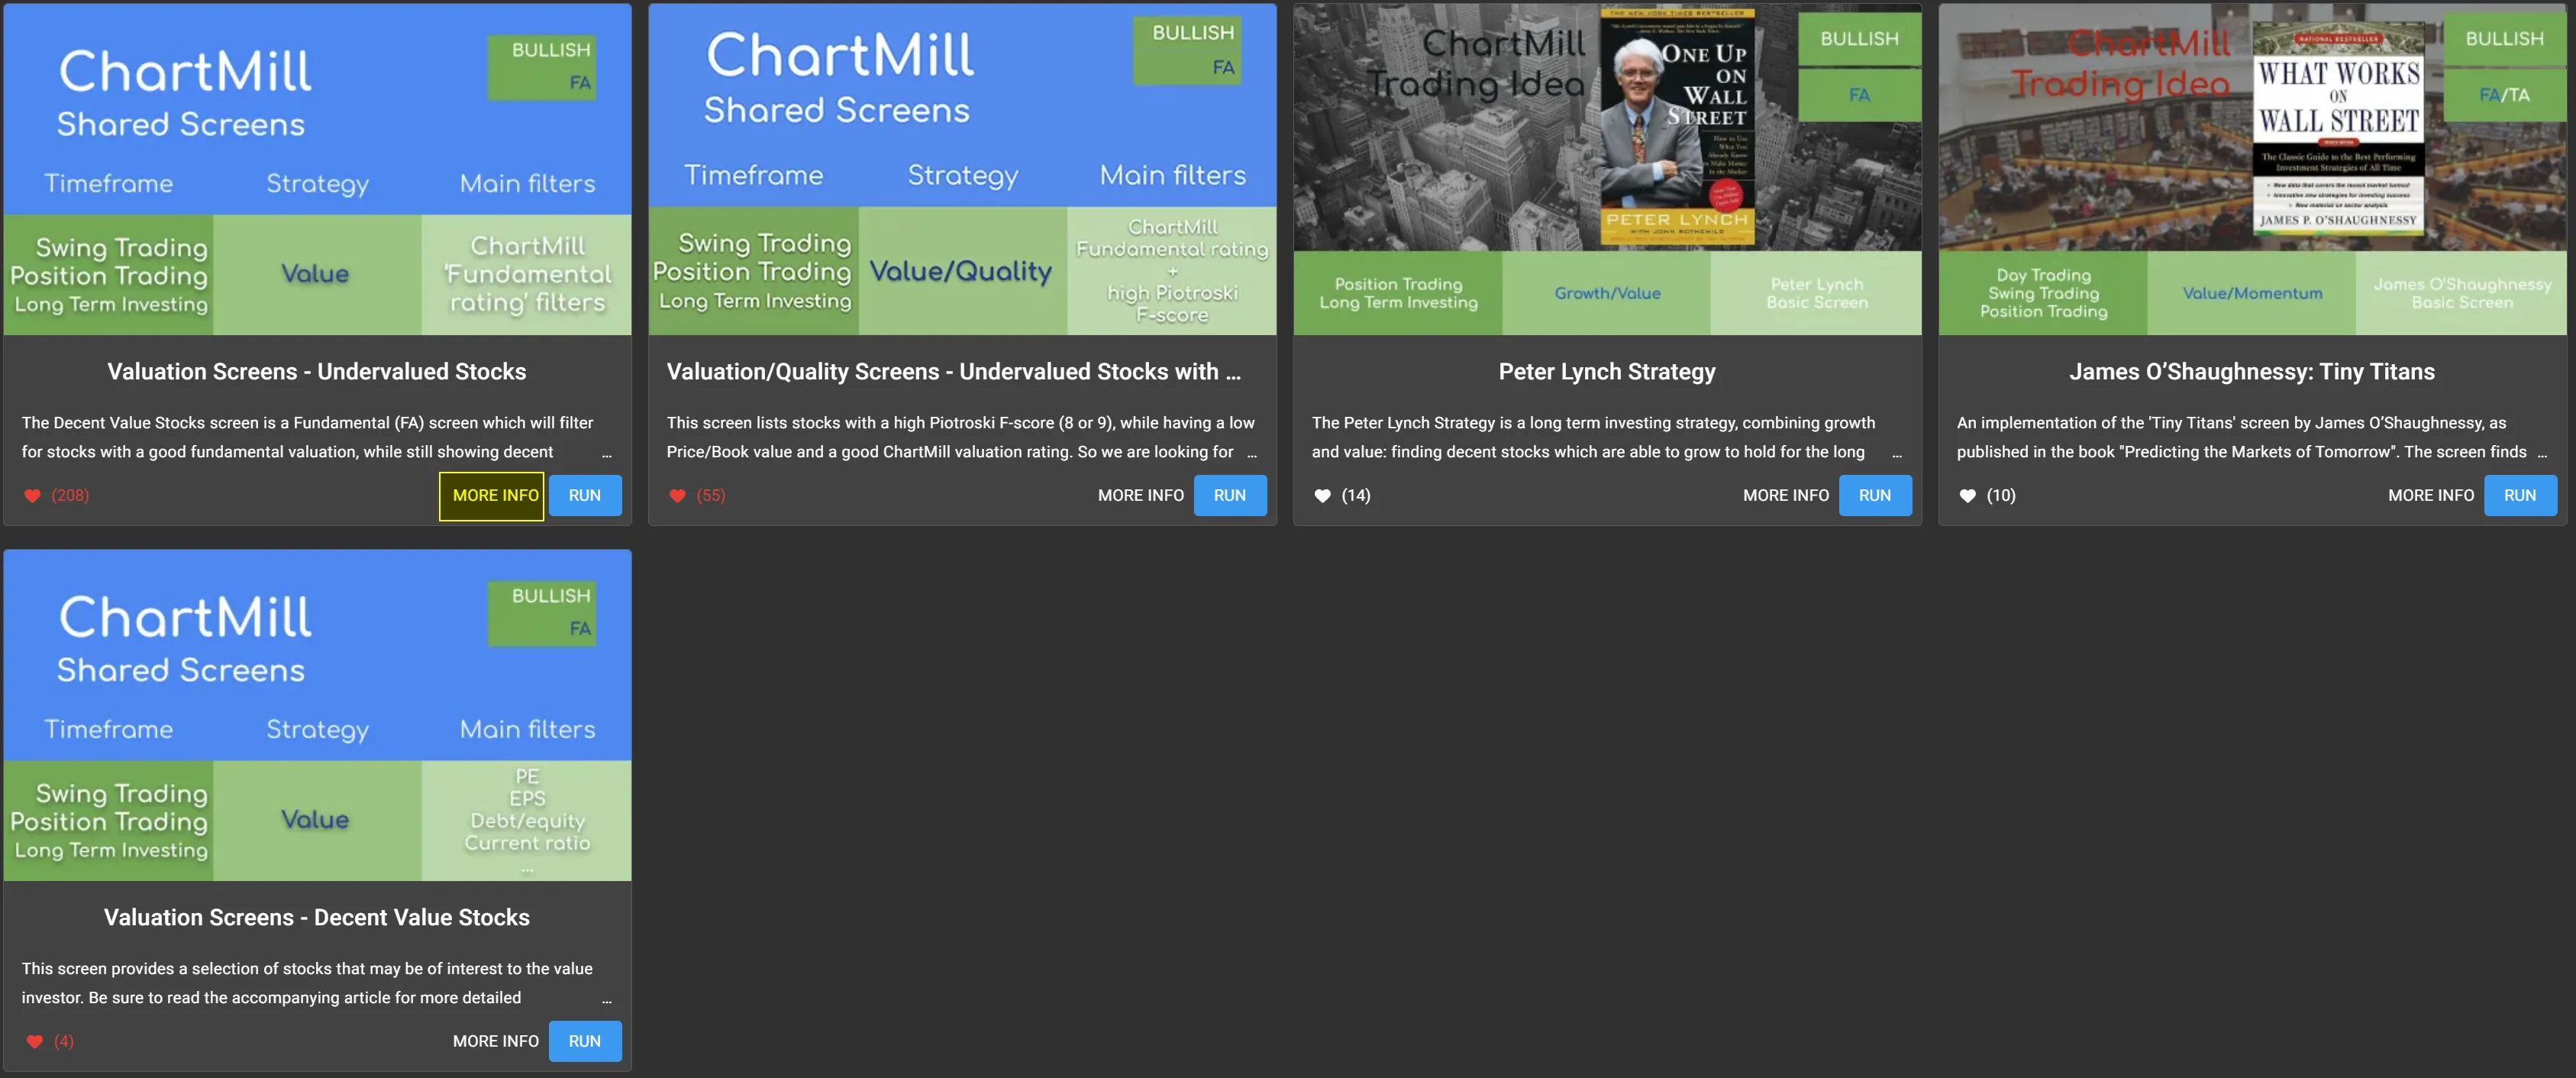
The Valuation Quality screen combines the ChartMill Valuation rating with individual ratios. Using the Regional Run option, you can easily set whether ChartMill should show results globally or for a specific region.
Certainly also worthwhile are the two value screens based on the writings of well-known investors. For example, we have a specific screen based on Peter Lynch's book "One Up On Wall Street".
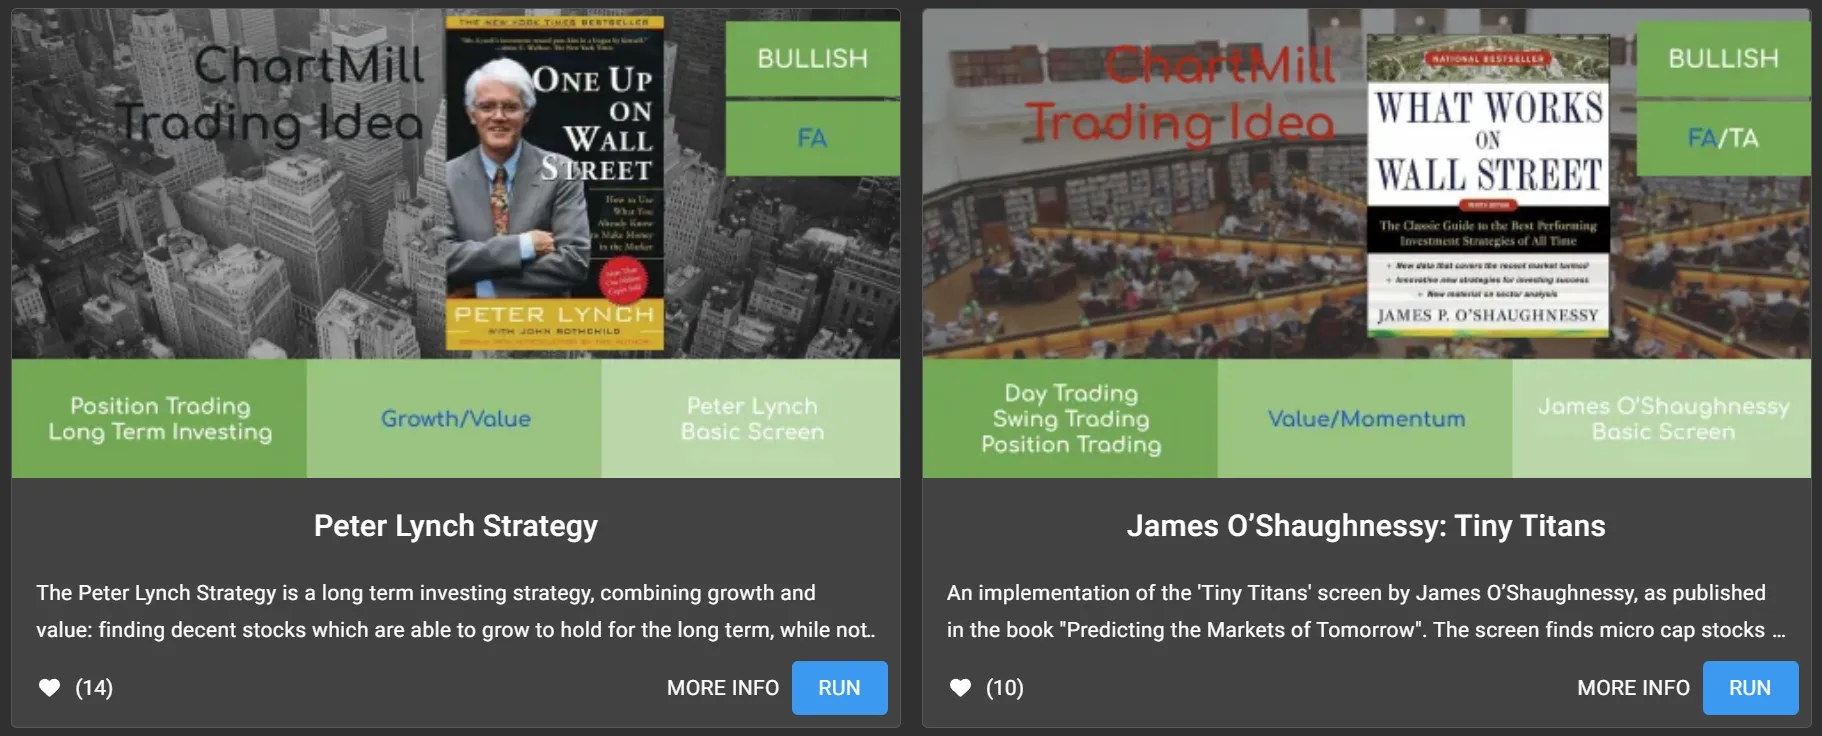
The parameters used in this screen are taken directly from his book. Click 'Run' to see the results when these filters are applied to the stocks in our database.
The trading idea next to it is based on the book "Predicting the Markets of Tomorrow" by James O'Shaughnessy. He is looking for so-called "Tiny Titans", microcap stocks with low P/E ratios that are sorted by relative strength.
In this way, he combines elements of value investing with the principles of momentum investing.
Finally, there is also the 'Decent Value Stocks' trading idea requiring a minimum dividend yield of 1% combined with various valuation and other ratios.
Option 3: Valuation Screening Filters
If you already have some more experience with fundamental analysis, then of course there is also the possibility to start completely from scratch and select your own parameters through the stock screener.
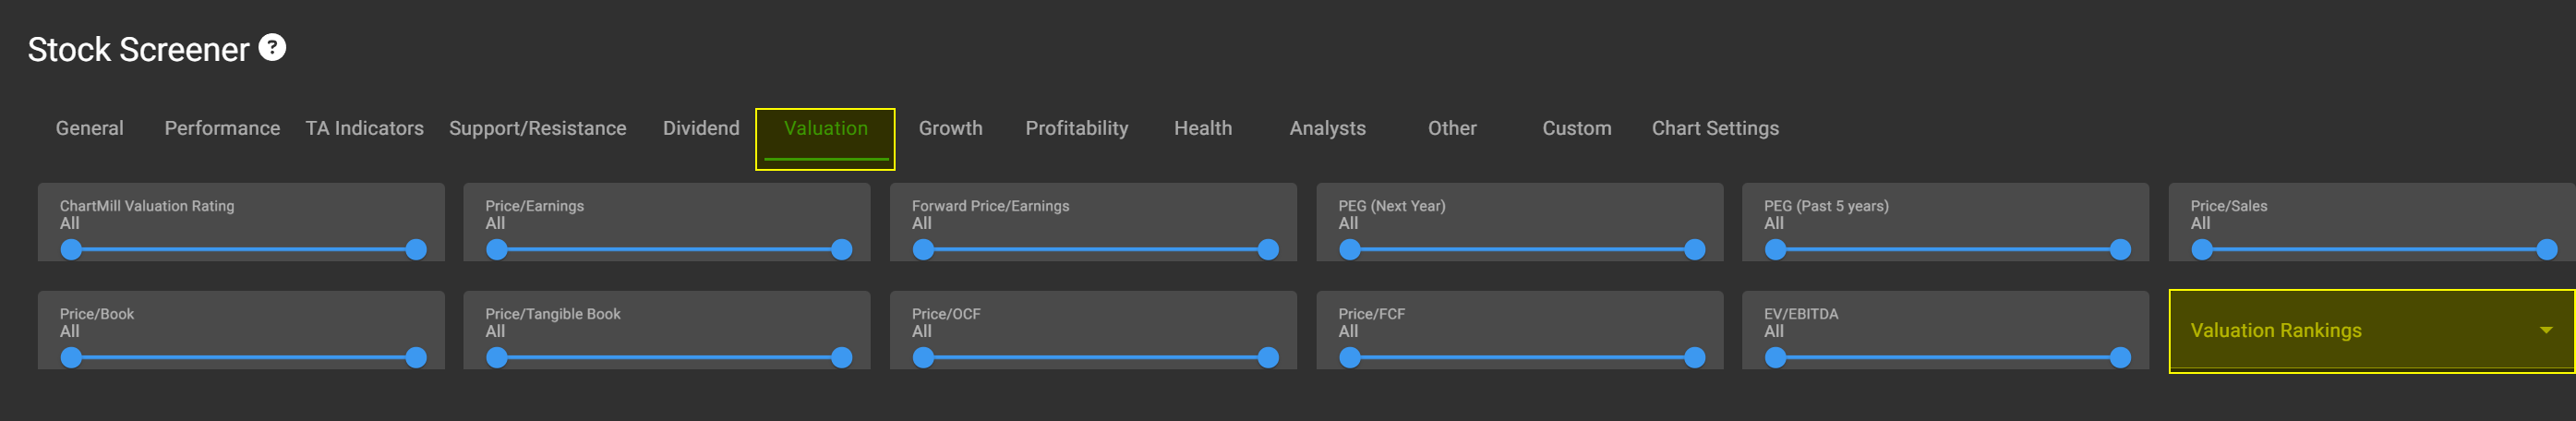
The Valuation tab already contains the valuation ratios which were discussed at the beginning of this video. In addition, the "Valuation Rankings" tab allows you to set how strongly a stock should perform on a specific ratio compared to other companies within the same sector or industry.
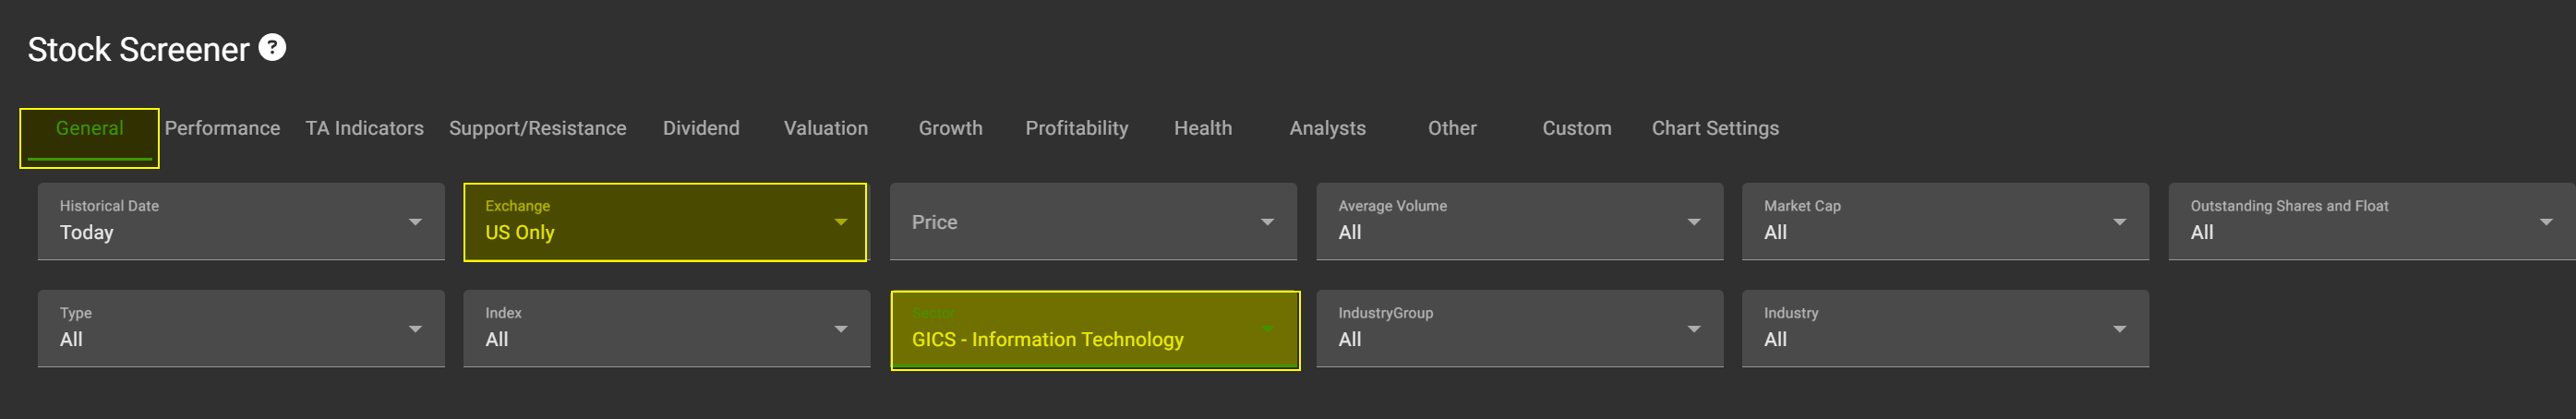
For example, suppose you want to know which US stocks within the information technology sector are among the top twenty percent in terms of P/E ratio.
To do so, you first select the 'General' tab and choose 'US only' and as sector 'GICS - Information Technology'.
Then go to the 'Valuation' tab and open the 'Valuation Rankings' dropdown menu (see above). There you select the option 'PE-Srank above 80 (the 'S' stands for Sector in this case). By doing this you have limited your search to the top 20% stocks in terms of P/E ratio.
Thus, you don't start by determining a specific lower or upper limit in terms of P/E ratio, but rather you start comparing results among the top 20% of companies in that sector. This is useful because in many cases the value of a specific fundamental ratio is sector-specific. What is considered a low value for one sector may be high for another sector.
Besides the valuation parameters, you also have the tabs 'growth', 'profitability', 'financial health', and 'dividend' that allow you to use other specific fundamental ratios.
And as already touched upon in this video, there are numerous ways to apply additional filters. Indeed, ChartMill also contains numerous technical and performance filters that allow you to easily combine fundamental and technical parameters.
As an example, take another look at Peter Lynch's valuation screen. You could, for example, refine the results with a bullish trend filter, retaining only the stocks whose price is higher than the 200-day average.
Would you like to know for which of those stocks the RSI is below 30? Just use the RSI filter found under the TA indicators tab.
There you have it, three different ways to compile in a short time a valuable basic list of potentially undervalued companies worth investigating further.
Be sure to get started yourself and discover the many possibilities ChartMill offers!
A video was also published for this article, which you can watch here.
Other relevant articles you may be interested in.
What is Value Investing?
This way of investing dates back about 100 years but remains to this day a highly regarded strategy with proven results. Benjamin Graham, an American economist and investor is the original creator of value investing. Read more...
How to find the best value stocks (using individual fundamental filters)?
In this article, I show how I use the stock screener to arrive at a basic list of stocks of interest to value investors. Read more...