
Don't overlook ZOOM COMMUNICATIONS INC (NASDAQ:ZM)—it's a hidden gem with strong fundamentals and an attractive price tag.
By Mill Chart
Last update: Mar 24, 2025
ZOOM COMMUNICATIONS INC (NASDAQ:ZM) is a hidden gem identified by our stock screening tool, featuring undervaluation and robust fundamentals. ZM showcases decent financial health and profitability, coupled with an attractive price. Let's dig deeper into the analysis.
Evaluating Valuation: ZM
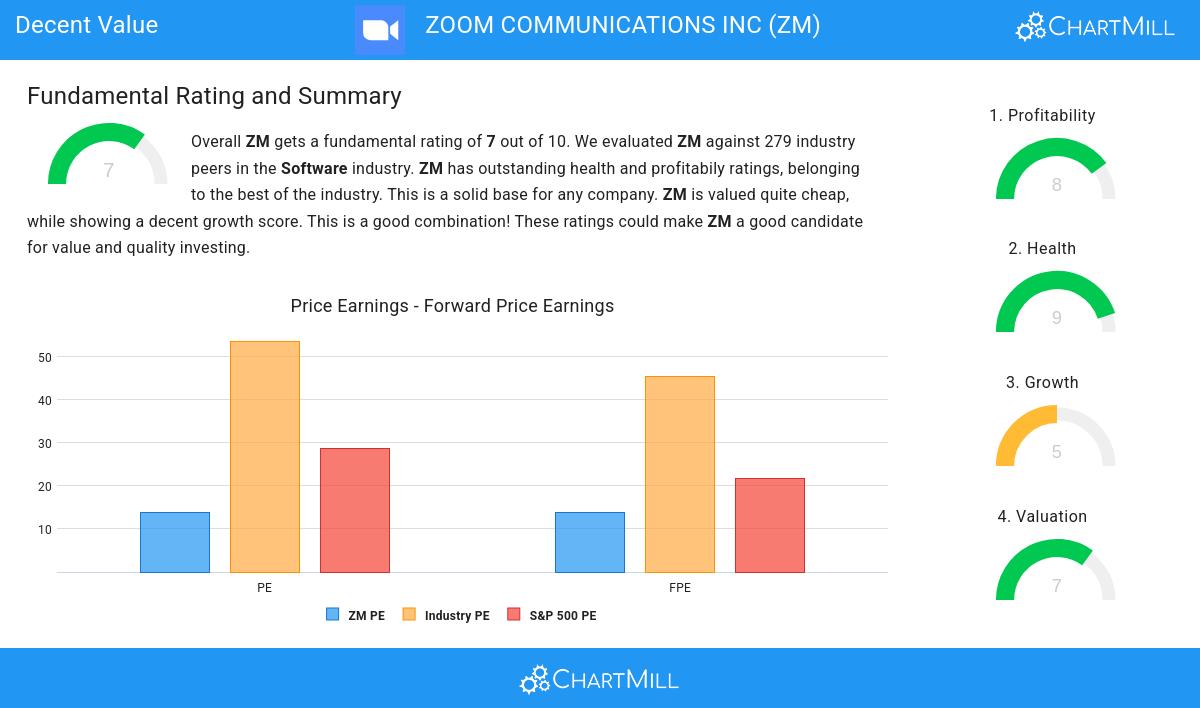
ChartMill assigns a proprietary Valuation Rating to each stock. The score is computed by evaluating various valuation aspects, like price to earnings and free cash flow, both absolutely as relative to the market and industry. ZM was assigned a score of 7 for valuation:
- ZM's Price/Earnings ratio is rather cheap when compared to the industry. ZM is cheaper than 86.74% of the companies in the same industry.
- The average S&P500 Price/Earnings ratio is at 28.62. ZM is valued rather cheaply when compared to this.
- Based on the Price/Forward Earnings ratio, ZM is valued cheaply inside the industry as 87.81% of the companies are valued more expensively.
- The average S&P500 Price/Forward Earnings ratio is at 21.72. ZM is valued slightly cheaper when compared to this.
- Compared to the rest of the industry, the Enterprise Value to EBITDA ratio of ZM indicates a rather cheap valuation: ZM is cheaper than 92.11% of the companies listed in the same industry.
- ZM's Price/Free Cash Flow ratio is rather cheap when compared to the industry. ZM is cheaper than 91.40% of the companies in the same industry.
- The excellent profitability rating of ZM may justify a higher PE ratio.
Looking at the Profitability
Discover ChartMill's exclusive Profitability Rating, a proprietary metric that assesses stocks on a scale of 0 to 10. It takes into consideration various profitability ratios and margins, both in absolute terms and relative to industry peers. Notably, ZM has achieved a 8:
- ZM has a better Return On Assets (9.19%) than 84.59% of its industry peers.
- The Return On Equity of ZM (11.31%) is better than 78.85% of its industry peers.
- ZM has a Return On Invested Capital of 6.87%. This is in the better half of the industry: ZM outperforms 79.21% of its industry peers.
- The last Return On Invested Capital (6.87%) for ZM is above the 3 year average (5.31%), which is a sign of increasing profitability.
- The Profit Margin of ZM (21.65%) is better than 86.38% of its industry peers.
- In the last couple of years the Profit Margin of ZM has grown nicely.
- With an excellent Operating Margin value of 17.43%, ZM belongs to the best of the industry, outperforming 84.59% of the companies in the same industry.
- ZM's Operating Margin has improved in the last couple of years.
- ZM has a better Gross Margin (75.79%) than 70.61% of its industry peers.
Deciphering ZM's Health Rating
ChartMill employs its own Health Rating for stock assessment. This rating, ranging from 0 to 10, is calculated by examining various liquidity and solvency ratios. In the case of ZM, the assigned 9 reflects its health status:
- An Altman-Z score of 8.67 indicates that ZM is not in any danger for bankruptcy at the moment.
- ZM's Altman-Z score of 8.67 is amongst the best of the industry. ZM outperforms 81.72% of its industry peers.
- ZM has no outstanding debt. Therefor its Debt/Equity and Debt/FCF ratios are 0 and belong to the best of the industry.
- ZM has a Current Ratio of 4.56. This indicates that ZM is financially healthy and has no problem in meeting its short term obligations.
- With an excellent Current ratio value of 4.56, ZM belongs to the best of the industry, outperforming 84.95% of the companies in the same industry.
- ZM has a Quick Ratio of 4.56. This indicates that ZM is financially healthy and has no problem in meeting its short term obligations.
- With an excellent Quick ratio value of 4.56, ZM belongs to the best of the industry, outperforming 84.95% of the companies in the same industry.
Evaluating Growth: ZM
ChartMill assigns a Growth Rating to every stock. This score ranges from 0 to 10 and evaluates the different growth aspects like EPS and Revenue, both in the past as in the future. ZM scores a 5 out of 10:
- The Earnings Per Share has been growing by 73.67% on average over the past years. This is a very strong growth
- Measured over the past years, ZM shows a very strong growth in Revenue. The Revenue has been growing by 49.60% on average per year.
More Decent Value stocks can be found in our Decent Value screener.
Check the latest full fundamental report of ZM for a complete fundamental analysis.
Keep in mind
Important Note: The content of this article is not intended as trading advice. It is essential to perform your own analysis and exercise caution when making trading decisions. The article presents observations created by automated analysis but does not guarantee any trading or investment outcomes. Always trade responsibly and make independent judgments.
