
Despite its impressive fundamentals,ZOOM COMMUNICATIONS INC (NASDAQ:ZM) remains undervalued.
By Mill Chart
Last update: Feb 28, 2025
ZOOM COMMUNICATIONS INC (NASDAQ:ZM) has caught the attention of our stock screener as a great value stock. NASDAQ:ZM excels in profitability, solvency, and liquidity, all while being very reasonably priced. Let's delve into the details.
What does the Valuation looks like for NASDAQ:ZM
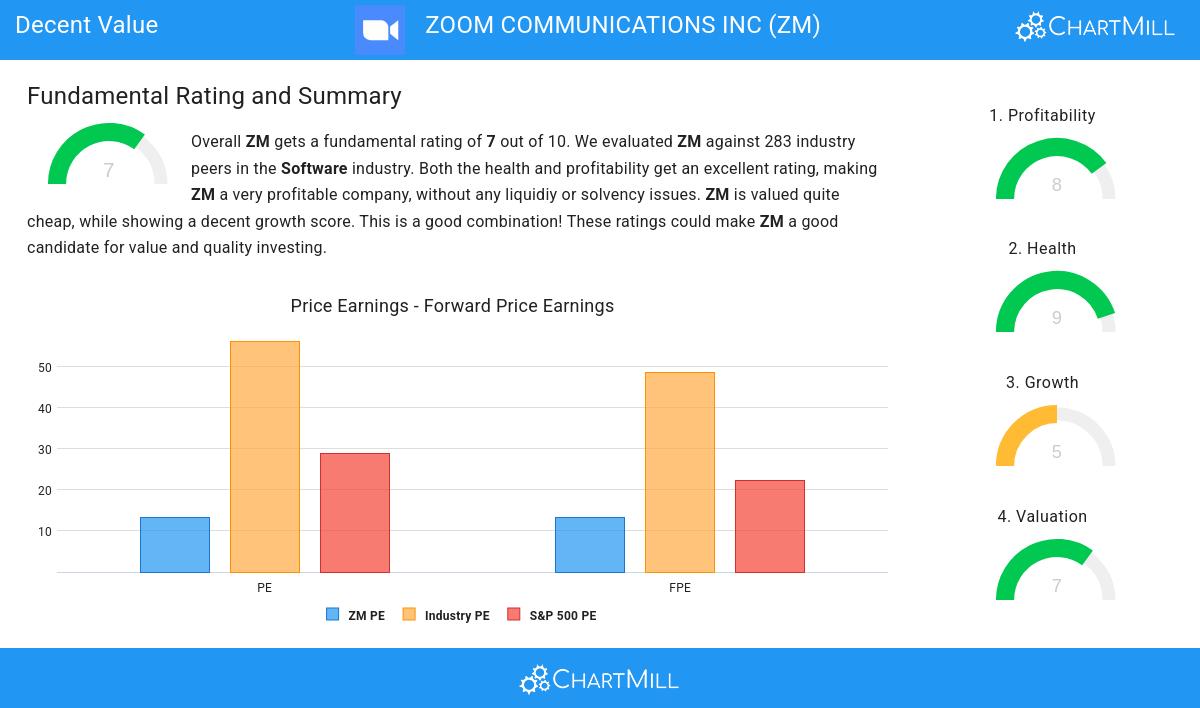
ChartMill assigns a Valuation Rating to each stock, ranging from 0 to 10. This rating is calculated by analyzing different valuation elements, such as price to earnings and free cash flow, both in absolute terms and relative to the market and industry. In the case of NASDAQ:ZM, the assigned 7 reflects its valuation:
- ZM's Price/Earnings ratio is rather cheap when compared to the industry. ZM is cheaper than 86.18% of the companies in the same industry.
- Compared to an average S&P500 Price/Earnings ratio of 29.01, ZM is valued rather cheaply.
- Based on the Price/Forward Earnings ratio, ZM is valued cheaply inside the industry as 88.36% of the companies are valued more expensively.
- The average S&P500 Price/Forward Earnings ratio is at 22.40. ZM is valued slightly cheaper when compared to this.
- 93.45% of the companies in the same industry are more expensive than ZM, based on the Enterprise Value to EBITDA ratio.
- Based on the Price/Free Cash Flow ratio, ZM is valued cheaply inside the industry as 91.64% of the companies are valued more expensively.
- The excellent profitability rating of ZM may justify a higher PE ratio.
A Closer Look at Profitability for NASDAQ:ZM
ChartMill utilizes a Profitability Rating to assess stocks, scoring them on a scale of 0 to 10. This rating takes into account a variety of profitability ratios and margins, both in absolute terms and in comparison to industry peers. NASDAQ:ZM has earned a 8 out of 10:
- ZM has a better Return On Assets (9.19%) than 85.09% of its industry peers.
- Looking at the Return On Equity, with a value of 11.31%, ZM is in the better half of the industry, outperforming 80.00% of the companies in the same industry.
- Looking at the Return On Invested Capital, with a value of 6.87%, ZM belongs to the top of the industry, outperforming 80.36% of the companies in the same industry.
- The 3 year average ROIC (5.31%) for ZM is below the current ROIC(6.87%), indicating increased profibility in the last year.
- Looking at the Profit Margin, with a value of 21.65%, ZM belongs to the top of the industry, outperforming 88.36% of the companies in the same industry.
- ZM's Profit Margin has improved in the last couple of years.
- ZM's Operating Margin of 17.43% is amongst the best of the industry. ZM outperforms 84.73% of its industry peers.
- In the last couple of years the Operating Margin of ZM has grown nicely.
- Looking at the Gross Margin, with a value of 75.79%, ZM is in the better half of the industry, outperforming 69.82% of the companies in the same industry.
Health Examination for NASDAQ:ZM
To gauge a stock's financial health, ChartMill utilizes a Health Rating on a scale of 0 to 10. This comprehensive evaluation encompasses liquidity and solvency, both in absolute terms and in comparison to industry peers. NASDAQ:ZM has earned a 9 out of 10:
- ZM has an Altman-Z score of 8.42. This indicates that ZM is financially healthy and has little risk of bankruptcy at the moment.
- ZM has a better Altman-Z score (8.42) than 78.18% of its industry peers.
- There is no outstanding debt for ZM. This means it has a Debt/Equity and Debt/FCF ratio of 0 and it is amongst the best of the sector and industry.
- A Current Ratio of 4.56 indicates that ZM has no problem at all paying its short term obligations.
- ZM has a Current ratio of 4.56. This is amongst the best in the industry. ZM outperforms 85.45% of its industry peers.
- A Quick Ratio of 4.56 indicates that ZM has no problem at all paying its short term obligations.
- Looking at the Quick ratio, with a value of 4.56, ZM belongs to the top of the industry, outperforming 85.45% of the companies in the same industry.
ChartMill's Evaluation of Growth
A key component of ChartMill's stock assessment is the Growth Rating, which spans from 0 to 10. This rating evaluates diverse growth factors, such as EPS and revenue growth, considering both past performance and future projections. NASDAQ:ZM has received a 5 out of 10:
- ZM shows a strong growth in Earnings Per Share. Measured over the last years, the EPS has been growing by 73.67% yearly.
- ZM shows a strong growth in Revenue. Measured over the last years, the Revenue has been growing by 49.60% yearly.
More Decent Value stocks can be found in our Decent Value screener.
Check the latest full fundamental report of ZM for a complete fundamental analysis.
Disclaimer
Important Note: The content of this article is not intended as trading advice. It is essential to perform your own analysis and exercise caution when making trading decisions. The article presents observations created by automated analysis but does not guarantee any trading or investment outcomes. Always trade responsibly and make independent judgments.
