
Indications Suggest ZIMMER BIOMET HOLDINGS INC (NYSE:ZBH) Could Be on the Verge of a Breakout.
By Mill Chart
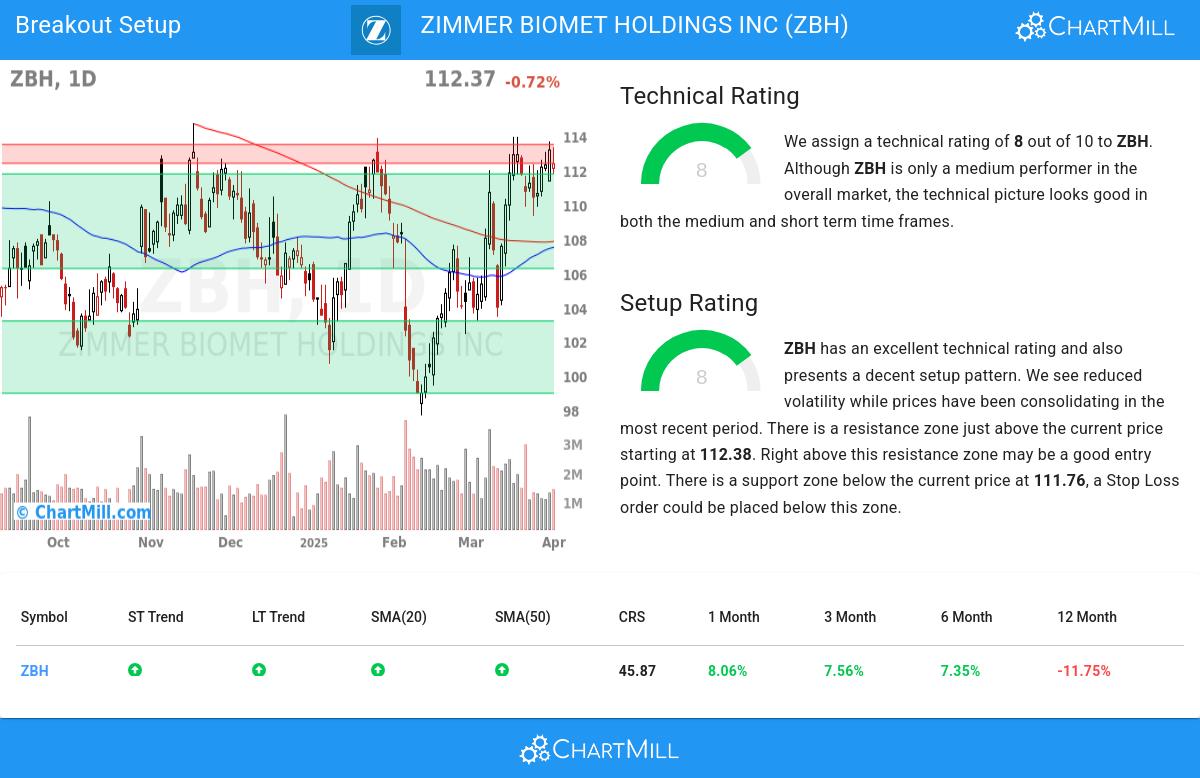
Last update: Apr 2, 2025
A possible breakout setup was detected on ZIMMER BIOMET HOLDINGS INC (NYSE:ZBH) by our stockscreener. A breakout pattern is formed when a stock consolidates after a strong rise up. We note that this pattern is detected purely based on technical analysis and whether the breakout actually materializes remains to be seen. It could be interesting to keep an eye on NYSE:ZBH.
Zooming in on the technicals.
Every day ChartMill assigns a Technical Rating to every stock. The score ranges from 0 to 10 and is determined by evaluating multiple technical indicators and properties.
Overall ZBH gets a technical rating of 8 out of 10. Although ZBH is only a medium performer in the overall market, the technical picture looks good in both the medium and short term time frames.
- Both the short term and long term trends are positive. This is a very positive sign.
- ZBH is one of the better performing stocks in the Health Care Equipment & Supplies industry, it outperforms 70% of 191 stocks in the same industry.
- In the last month ZBH has a been trading in the 103.21 - 113.94 range, which is quite wide. It is currently trading near the high of this range.
- When compared to the yearly performance of all other stocks, ZBH outperforms 45% of them, which is more or less in line with the market.
- ZBH is currently trading in the middle of its 52 week range. This is in line with the S&P500 Index, which is also trading in the middle of its range.
Check the latest full technical report of ZBH for a complete technical analysis.
How does the Setup look for ZBH
Besides the Technical Rating, ChartMill also assign a Setup Rating to every stock. This setup score also ranges from 0 to 10 and determines to which extend the stock is consolidating. This is achieved by evaluating multiple short term technical indicators. ZBH currently has a 8 as setup rating:
ZBH has an excellent technical rating and also presents a decent setup pattern. We see reduced volatility while prices have been consolidating in the most recent period. There is a resistance zone just above the current price starting at 112.38. Right above this resistance zone may be a good entry point. There is a support zone below the current price at 111.76, a Stop Loss order could be placed below this zone.
Trading breakout setups.
For a potential trade one would typically wait until the stock breaks out of the consolidation zone to enter the stock and it could be sold again for a loss when it would fall back below the zone.
Disclaimer: This article is not intended to provide trading advice. It is crucial to conduct your own analysis and consider your own observations and trading style when making investment decisions. The article solely presents technical observations and should not be relied upon as a sole basis for trading.
Every day, new breakout setups can be found on ChartMill in our Breakout screener.
Disclaimer
Important Note: The content of this article is not intended as trading advice. It is essential to perform your own analysis and exercise caution when making trading decisions. The article presents observations created by automated analysis but does not guarantee any trading or investment outcomes. Always trade responsibly and make independent judgments.
101.5
+2.05 (+2.06%)
Find more stocks in the Stock Screener
ZBH Latest News and Analysis
 9 days ago - ChartmillUncover the latest developments among S&P500 stocks in today's session.
Stay informed about the performance of the S&P500 index one hour before the close of the markets on Tuesday. Uncover the top gainers and losers in today's session for valuable insights.
10 days ago - ChartmillWhich S&P500 stocks are moving on Tuesday?Stay informed about the performance of the S&P500 index in the middle of the day on Tuesday. Uncover the top gainers and losers in today's session for valuable insights.
 10 days ago - ChartmillWhat's going on in today's session: S&P500 gap up and gap down stocks
Let's take a look at the S&P500 stocks that are experiencing notable price gaps in today's session on Tuesday. Discover the gap up and gap down stocks in the S&P500 index.
