
Technical Signals Point to a Possible Breakout for YUM! BRANDS INC (NYSE:YUM).
By Mill Chart
Last update: Mar 19, 2025
Our stock screener has identified YUM! BRANDS INC (NYSE:YUM) as a potential breakout candidate. This technical breakout setup pattern occurs when the stock consolidates after a strong uptrend. While the actual breakout is uncertain, it may be worth keeping an eye on NYSE:YUM.
Technical analysis of YUM
Every day, ChartMill assigns a Technical Rating to each stock, providing a score ranging from 0 to 10. This rating is determined by evaluating various technical indicators and properties.
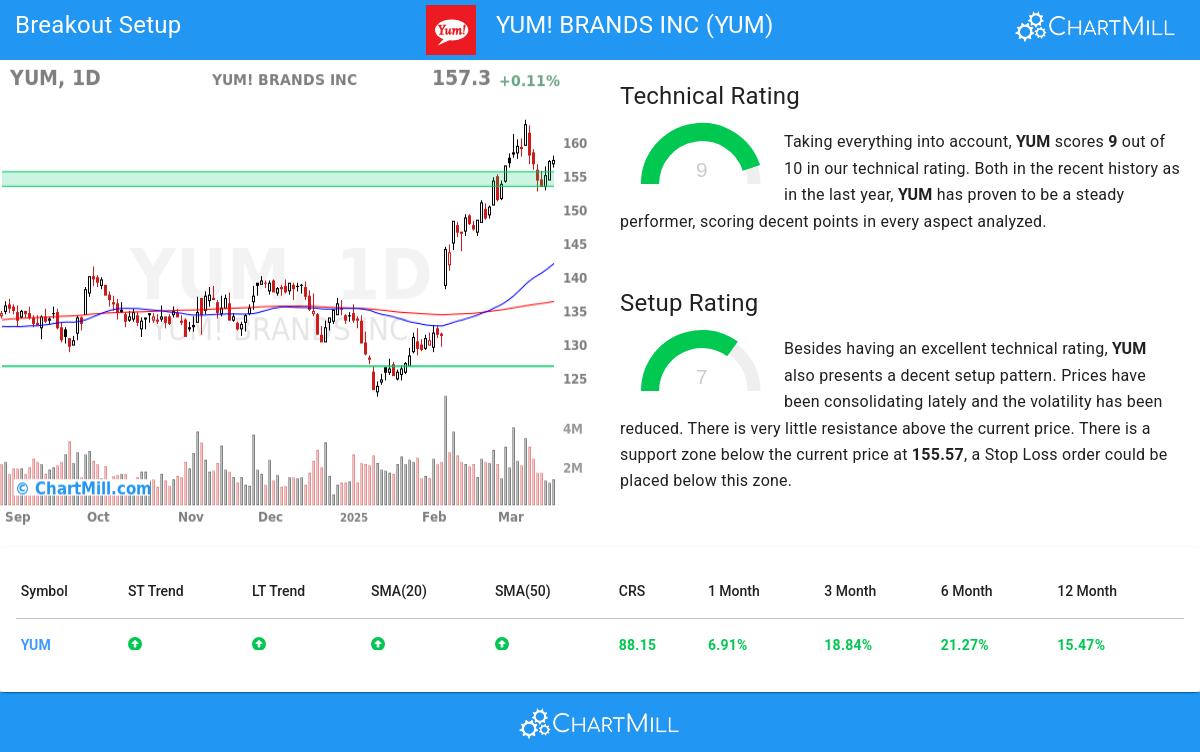
We assign a technical rating of 9 out of 10 to YUM. Both in the recent history as in the last year, YUM has proven to be a steady performer, scoring decent points in every aspect analyzed.
- Both the short term and long term trends are positive. This is a very positive sign.
- YUM is one of the better performing stocks in the Hotels, Restaurants & Leisure industry, it outperforms 79% of 134 stocks in the same industry.
- YUM is currently trading in the upper part of its 52 week range. The market is still in the middle of its 52 week range, so YUM slightly outperforms the market at the moment.
- Looking at the yearly performance, YUM did better than 88% of all other stocks. However, this overall good ranking is mostly due to the recent strong move.
- In the last month YUM has a been trading in the 145.98 - 163.30 range, which is quite wide. It is currently trading in the middle of this range, so some resistance may be found above.
Check the latest full technical report of YUM for a complete technical analysis.
How does the Setup look for YUM
ChartMill incorporates a Setup Rating in its analysis, which measures the extent of consolidation in a stock over recent days and weeks. This rating, ranging from 0 to 10, is updated daily and takes into account multiple short-term technical indicators. The current setup rating for YUM is 7:
Besides having an excellent technical rating, YUM also presents a decent setup pattern. We see reduced volatility while prices have been consolidating in the most recent period. There is very little resistance above the current price. There is a support zone below the current price at 155.57, a Stop Loss order could be placed below this zone.
How to trade YUM?
A breakout opportunity may arise when the stock surpasses the current consolidation zone and reaches new highs. Traders often wait for this breakout before considering buying the stock. To manage risk, a stop loss order could be placed below the consolidation zone to limit potential losses.
Important Note: The content of this article is not intended as trading advice. It is essential to perform your own analysis and exercise caution when making trading decisions. The article presents technical observations generated by automated analysis but does not guarantee any trading outcomes. Always trade responsibly and make independent judgments.
Every day, new breakout setups can be found on ChartMill in our Breakout screener.
Keep in mind
This is not investing advice! The article highlights some of the observations at the time of writing, but you should always make your own analysis and invest based on your own insights.
