
Consider YUM! BRANDS INC (NYSE:YUM) as a top pick for dividend investors, identified by our stock screening tool. NYSE:YUM shines in terms of profitability, solvency, and liquidity, all while paying a decent dividend. Let's dive deeper into the analysis.
ChartMill's Evaluation of Dividend
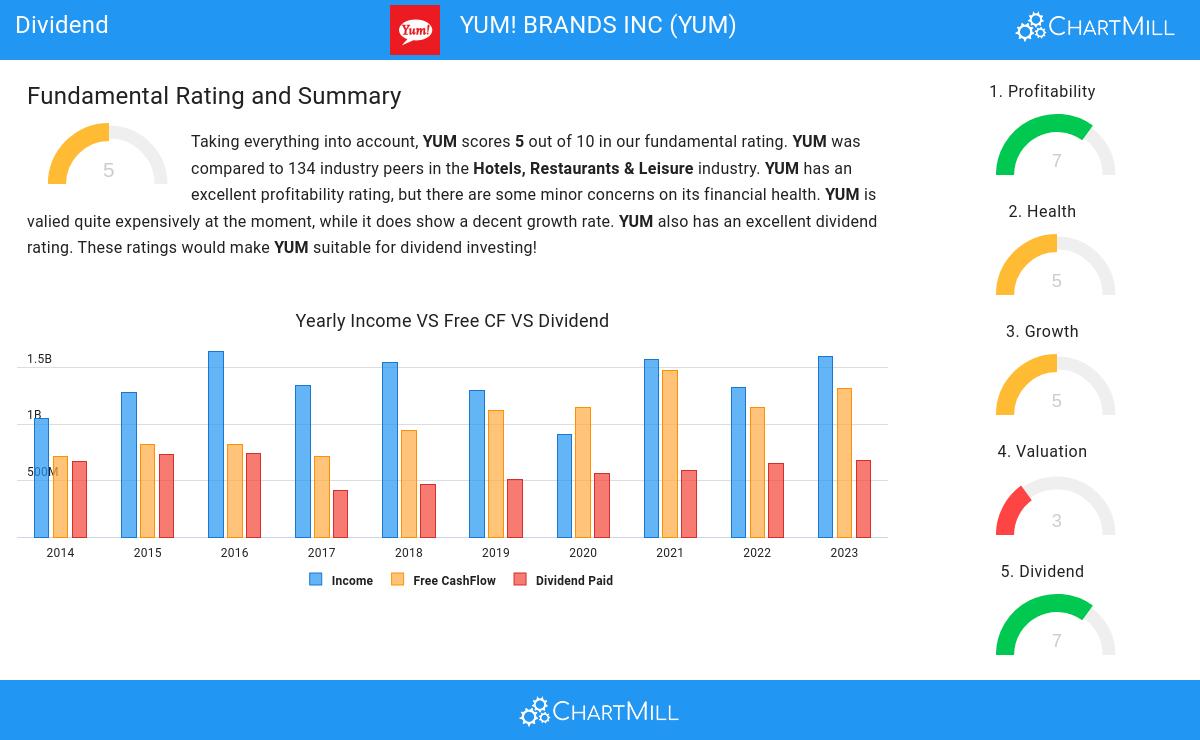
ChartMill assigns a proprietary Dividend Rating to each stock. The score is computed by evaluating various valuation aspects, like the yield, the history, the dividend growth and sustainability. NYSE:YUM was assigned a score of 7 for dividend:
- Compared to an average industry Dividend Yield of 2.99, YUM pays a better dividend. On top of this YUM pays more dividend than 80.45% of the companies listed in the same industry.
- The dividend of YUM is nicely growing with an annual growth rate of 10.79%!
- YUM has paid a dividend for at least 10 years, which is a reliable track record.
- YUM has not decreased its dividend in the past 5 years, so it has a somewhat stable track record.
- YUM's earnings are growing more than its dividend. This makes the dividend growth sustainable.
Evaluating Health: NYSE:YUM
To gauge a stock's financial health, ChartMill utilizes a Health Rating on a scale of 0 to 10. This comprehensive evaluation encompasses liquidity and solvency, both in absolute terms and in comparison to industry peers. NYSE:YUM has earned a 5 out of 10:
- With a decent Altman-Z score value of 2.42, YUM is doing good in the industry, outperforming 71.43% of the companies in the same industry.
- YUM has a better Debt to FCF ratio (8.16) than 68.42% of its industry peers.
- YUM has a Current ratio of 1.44. This is in the better half of the industry: YUM outperforms 68.42% of its industry peers.
- With a decent Quick ratio value of 1.44, YUM is doing good in the industry, outperforming 72.18% of the companies in the same industry.
A Closer Look at Profitability for NYSE:YUM
ChartMill assigns a Profitability Rating to every stock. This score ranges from 0 to 10 and evaluates the different profitability ratios and margins, both absolutely, but also relative to the industry peers. NYSE:YUM scores a 7 out of 10:
- YUM's Return On Assets of 24.39% is amongst the best of the industry. YUM outperforms 98.50% of its industry peers.
- YUM has a better Return On Invested Capital (37.26%) than 97.74% of its industry peers.
- Measured over the past 3 years, the Average Return On Invested Capital for YUM is significantly above the industry average of 10.18%.
- Looking at the Profit Margin, with a value of 21.96%, YUM belongs to the top of the industry, outperforming 93.98% of the companies in the same industry.
- With an excellent Operating Margin value of 32.92%, YUM belongs to the best of the industry, outperforming 96.99% of the companies in the same industry.
Our Best Dividend screener lists more Best Dividend stocks and is updated daily.
For an up to date full fundamental analysis you can check the fundamental report of YUM
Disclaimer
Important Note: The content of this article is not intended as trading advice. It is essential to perform your own analysis and exercise caution when making trading decisions. The article presents observations created by automated analysis but does not guarantee any trading or investment outcomes. Always trade responsibly and make independent judgments.

