
Take a closer look at YUM! BRANDS INC (NYSE:YUM), a stock of interest to dividend investors uncovered by our stock screener. NYSE:YUM excels in fundamentals and provides a decent dividend, all while maintaining a reasonable valuation. Let's break it down further.
Deciphering NYSE:YUM's Dividend Rating
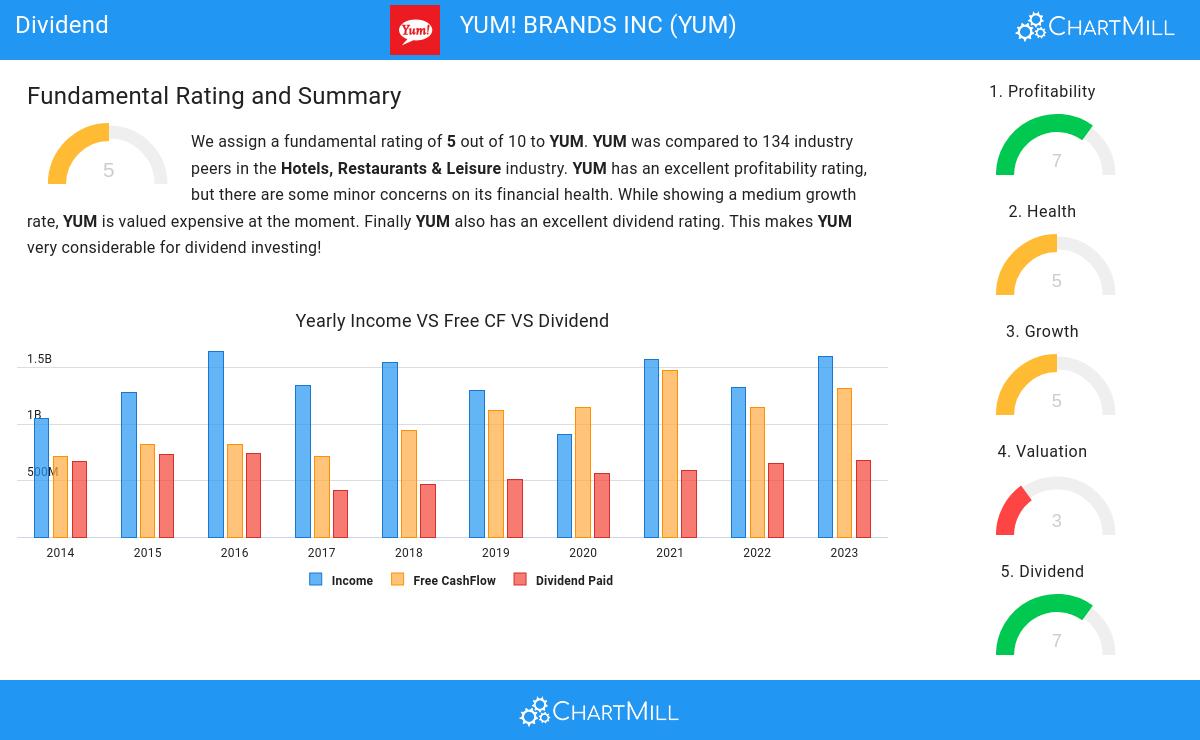
ChartMill assigns a Dividend Rating to each stock, ranging from 0 to 10. This rating is calculated by analyzing various dividend elements, such as yield, historical performance, dividend growth, and sustainability. NYSE:YUM has been awarded a 7 for its dividend quality:
- Compared to an average industry Dividend Yield of 3.13, YUM pays a better dividend. On top of this YUM pays more dividend than 80.60% of the companies listed in the same industry.
- The dividend of YUM is nicely growing with an annual growth rate of 10.79%!
- YUM has paid a dividend for at least 10 years, which is a reliable track record.
- YUM has not decreased its dividend in the past 5 years, so it has a somewhat stable track record.
- YUM's earnings are growing more than its dividend. This makes the dividend growth sustainable.
Understanding NYSE:YUM's Health
ChartMill assigns a proprietary Health Rating to each stock. The score is computed by evaluating various liquidity and solvency ratios and ranges from 0 to 10. NYSE:YUM was assigned a score of 5 for health:
- YUM has a Altman-Z score of 2.48. This is in the better half of the industry: YUM outperforms 70.15% of its industry peers.
- With a decent Debt to FCF ratio value of 8.16, YUM is doing good in the industry, outperforming 67.16% of the companies in the same industry.
- The Current ratio of YUM (1.44) is better than 67.91% of its industry peers.
- YUM has a better Quick ratio (1.44) than 71.64% of its industry peers.
A Closer Look at Profitability for NYSE:YUM
Discover ChartMill's exclusive Profitability Rating, a proprietary metric that assesses stocks on a scale of 0 to 10. It takes into consideration various profitability ratios and margins, both in absolute terms and relative to industry peers. Notably, NYSE:YUM has achieved a 7:
- Looking at the Return On Assets, with a value of 24.39%, YUM belongs to the top of the industry, outperforming 98.51% of the companies in the same industry.
- YUM has a better Return On Invested Capital (37.26%) than 97.76% of its industry peers.
- Measured over the past 3 years, the Average Return On Invested Capital for YUM is significantly above the industry average of 10.09%.
- YUM has a better Profit Margin (21.96%) than 94.03% of its industry peers.
- The Operating Margin of YUM (32.92%) is better than 97.01% of its industry peers.
More Best Dividend stocks can be found in our Best Dividend screener.
For an up to date full fundamental analysis you can check the fundamental report of YUM
Keep in mind
This is not investing advice! The article highlights some of the observations at the time of writing, but you should always make your own analysis and invest based on your own insights.