
Our stock screener has spotted WEST PHARMACEUTICAL SERVICES (NYSE:WST) as a good dividend stock with solid fundamentals. NYSE:WST shows decent health and profitability. At the same time it gives a good and sustainable dividend. We'll dive into each aspect below.
Understanding NYSE:WST's Dividend
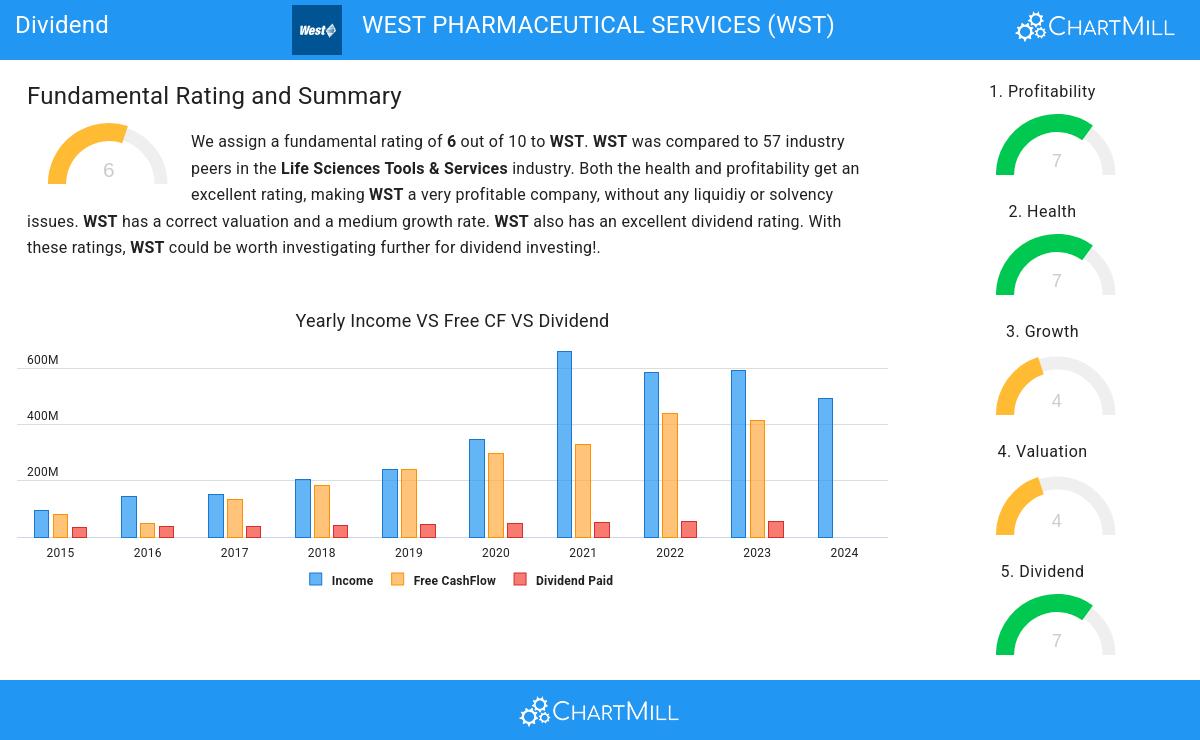
ChartMill assigns a proprietary Dividend Rating to each stock. The score is computed by evaluating various valuation aspects, like the yield, the history, the dividend growth and sustainability. NYSE:WST was assigned a score of 7 for dividend:
- Compared to an average industry Dividend Yield of 0.42, WST pays a better dividend. On top of this WST pays more dividend than 91.23% of the companies listed in the same industry.
- The dividend of WST is nicely growing with an annual growth rate of 6.31%!
- WST has paid a dividend for at least 10 years, which is a reliable track record.
- WST has not decreased its dividend for at least 10 years, so it has a reliable track record of non decreasing dividend.
- 11.73% of the earnings are spent on dividend by WST. This is a low number and sustainable payout ratio.
- WST's earnings are growing more than its dividend. This makes the dividend growth sustainable.
Exploring NYSE:WST's Health
ChartMill assigns a proprietary Health Rating to each stock. The score is computed by evaluating various liquidity and solvency ratios and ranges from 0 to 10. NYSE:WST was assigned a score of 7 for health:
- WST has an Altman-Z score of 13.22. This indicates that WST is financially healthy and has little risk of bankruptcy at the moment.
- The Altman-Z score of WST (13.22) is better than 100.00% of its industry peers.
- WST has a debt to FCF ratio of 0.64. This is a very positive value and a sign of high solvency as it would only need 0.64 years to pay back of all of its debts.
- Looking at the Debt to FCF ratio, with a value of 0.64, WST belongs to the top of the industry, outperforming 92.98% of the companies in the same industry.
- A Debt/Equity ratio of 0.07 indicates that WST is not too dependend on debt financing.
- Looking at the Debt to Equity ratio, with a value of 0.07, WST is in the better half of the industry, outperforming 66.67% of the companies in the same industry.
- A Current Ratio of 3.00 indicates that WST has no problem at all paying its short term obligations.
- WST has a Quick Ratio of 2.23. This indicates that WST is financially healthy and has no problem in meeting its short term obligations.
Profitability Examination for NYSE:WST
ChartMill assigns a proprietary Profitability Rating to each stock. The score is computed by evaluating various profitability ratios and margins and ranges from 0 to 10. NYSE:WST was assigned a score of 7 for profitability:
- With an excellent Return On Assets value of 13.59%, WST belongs to the best of the industry, outperforming 94.74% of the companies in the same industry.
- Looking at the Return On Equity, with a value of 18.15%, WST belongs to the top of the industry, outperforming 92.98% of the companies in the same industry.
- With an excellent Return On Invested Capital value of 15.22%, WST belongs to the best of the industry, outperforming 96.49% of the companies in the same industry.
- With an excellent Profit Margin value of 17.37%, WST belongs to the best of the industry, outperforming 92.98% of the companies in the same industry.
- In the last couple of years the Profit Margin of WST has grown nicely.
- With an excellent Operating Margin value of 20.37%, WST belongs to the best of the industry, outperforming 85.96% of the companies in the same industry.
- In the last couple of years the Operating Margin of WST has grown nicely.
More Best Dividend stocks can be found in our Best Dividend screener.
Check the latest full fundamental report of WST for a complete fundamental analysis.
Keep in mind
This is not investing advice! The article highlights some of the observations at the time of writing, but you should always make your own analysis and invest based on your own insights.