
Our stock screening tool has identified WEST PHARMACEUTICAL SERVICES (NYSE:WST) as a strong dividend contender with robust fundamentals. NYSE:WST exhibits commendable financial health and profitability, all while offering a sustainable dividend. Let's delve into each aspect below.
Dividend Analysis for NYSE:WST
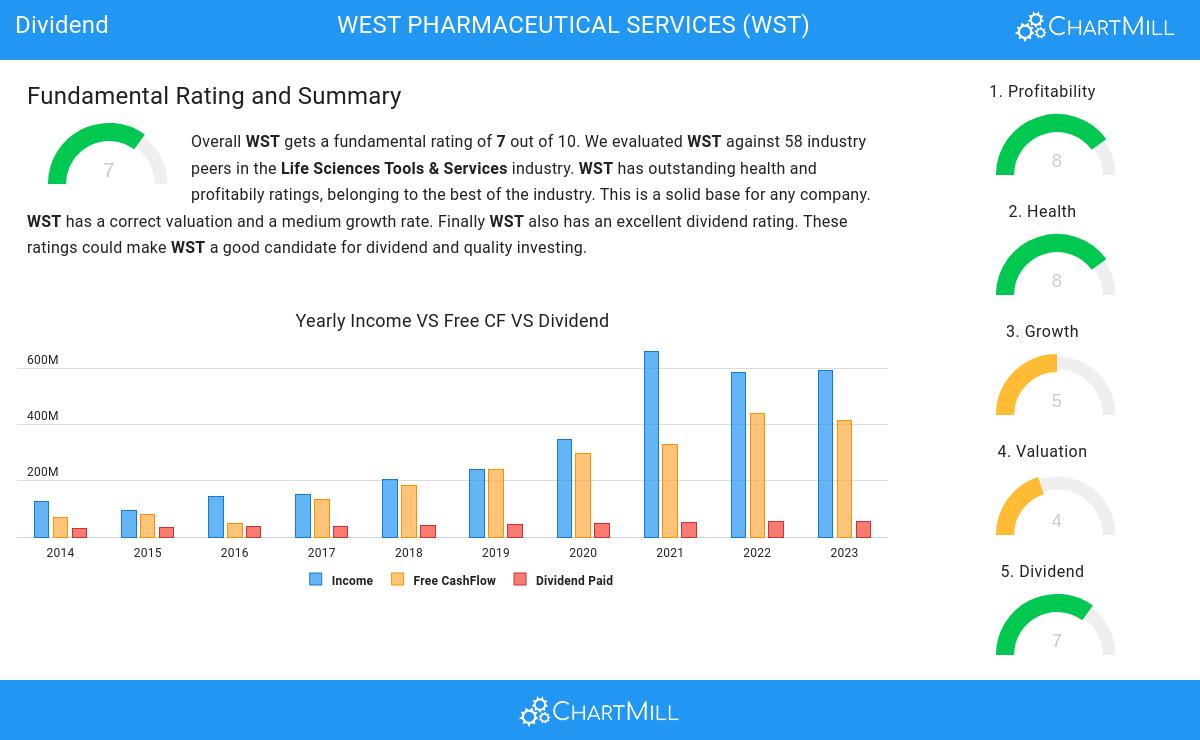
ChartMill assigns a Dividend Rating to each stock, ranging from 0 to 10. This rating is calculated by analyzing various dividend elements, such as yield, historical performance, dividend growth, and sustainability. NYSE:WST has been awarded a 7 for its dividend quality:
- Compared to an average industry Dividend Yield of 0.63, WST pays a better dividend. On top of this WST pays more dividend than 87.93% of the companies listed in the same industry.
- On average, the dividend of WST grows each year by 6.31%, which is quite nice.
- WST has paid a dividend for at least 10 years, which is a reliable track record.
- WST has not decreased their dividend for at least 10 years, which is a reliable track record.
- WST pays out 11.07% of its income as dividend. This is a sustainable payout ratio.
- WST's earnings are growing more than its dividend. This makes the dividend growth sustainable.
A Closer Look at Health for NYSE:WST
To gauge a stock's financial health, ChartMill utilizes a Health Rating on a scale of 0 to 10. This comprehensive evaluation encompasses liquidity and solvency, both in absolute terms and in comparison to industry peers. NYSE:WST has earned a 8 out of 10:
- WST has an Altman-Z score of 17.52. This indicates that WST is financially healthy and has little risk of bankruptcy at the moment.
- WST has a Altman-Z score of 17.52. This is amongst the best in the industry. WST outperforms 100.00% of its industry peers.
- WST has a debt to FCF ratio of 0.59. This is a very positive value and a sign of high solvency as it would only need 0.59 years to pay back of all of its debts.
- WST has a better Debt to FCF ratio (0.59) than 93.10% of its industry peers.
- WST has a Debt/Equity ratio of 0.03. This is a healthy value indicating a solid balance between debt and equity.
- With a decent Debt to Equity ratio value of 0.03, WST is doing good in the industry, outperforming 70.69% of the companies in the same industry.
- WST has a Current Ratio of 2.34. This indicates that WST is financially healthy and has no problem in meeting its short term obligations.
Profitability Insights: NYSE:WST
ChartMill assigns a Profitability Rating to every stock. This score ranges from 0 to 10 and evaluates the different profitability ratios and margins, both absolutely, but also relative to the industry peers. NYSE:WST scores a 8 out of 10:
- Looking at the Return On Assets, with a value of 15.04%, WST belongs to the top of the industry, outperforming 96.55% of the companies in the same industry.
- WST has a Return On Equity of 20.37%. This is amongst the best in the industry. WST outperforms 91.38% of its industry peers.
- The Return On Invested Capital of WST (17.43%) is better than 94.83% of its industry peers.
- The Average Return On Invested Capital over the past 3 years for WST is significantly above the industry average of 10.88%.
- With an excellent Profit Margin value of 18.25%, WST belongs to the best of the industry, outperforming 93.10% of the companies in the same industry.
- WST's Profit Margin has improved in the last couple of years.
- WST has a Operating Margin of 20.99%. This is amongst the best in the industry. WST outperforms 87.93% of its industry peers.
- In the last couple of years the Operating Margin of WST has grown nicely.
- WST's Gross Margin has improved in the last couple of years.
Our Best Dividend screener lists more Best Dividend stocks and is updated daily.
Our latest full fundamental report of WST contains the most current fundamental analsysis.
Disclaimer
This is not investing advice! The article highlights some of the observations at the time of writing, but you should always make your own analysis and invest based on your own insights.