Why the dividend investor may take a look at NYSE:WSM.
By Mill Chart
Last update: Feb 5, 2025
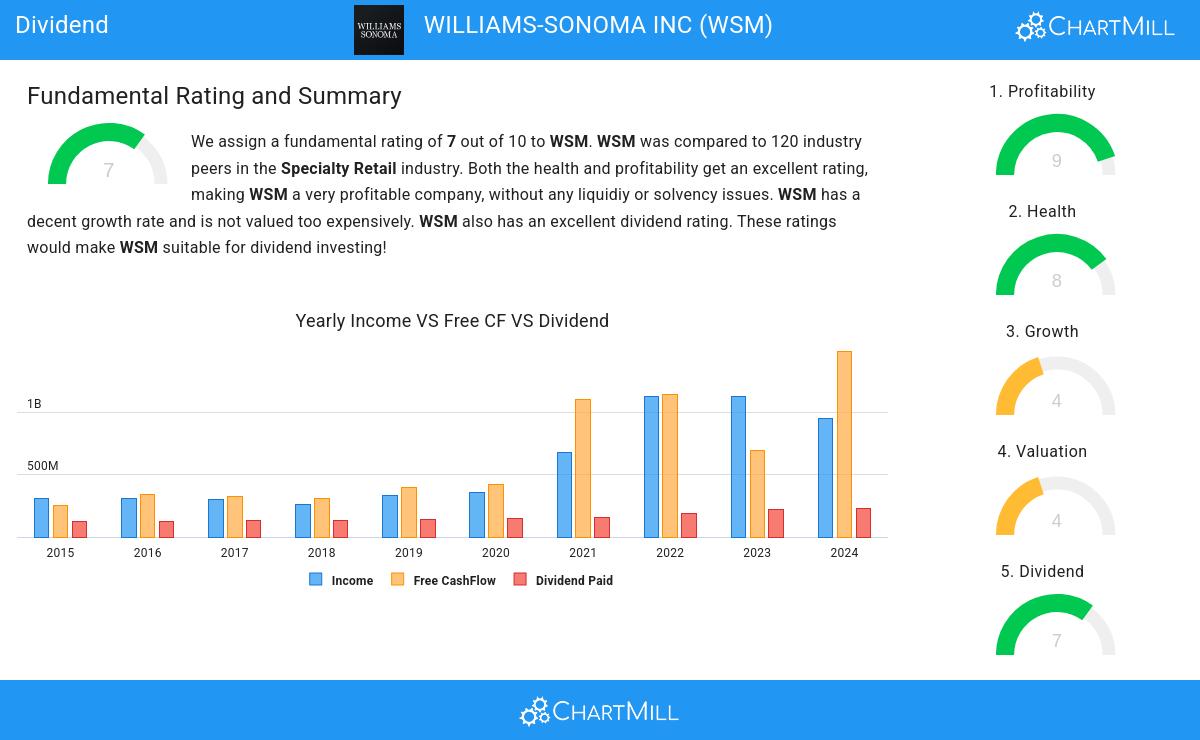
Our stock screener has spotted WILLIAMS-SONOMA INC (NYSE:WSM) as a good dividend stock with solid fundamentals. NYSE:WSM shows decent health and profitability. At the same time it gives a good and sustainable dividend. We'll dive into each aspect below.
Assessing Dividend Metrics for NYSE:WSM
ChartMill assigns a Dividend Rating to each stock, ranging from 0 to 10. This rating is calculated by analyzing various dividend elements, such as yield, historical performance, dividend growth, and sustainability. NYSE:WSM has been awarded a 7 for its dividend quality:
- WSM's Dividend Yield is a higher than the industry average which is at 3.31.
- On average, the dividend of WSM grows each year by 6.72%, which is quite nice.
- WSM has been paying a dividend for at least 10 years, so it has a reliable track record.
- WSM has not decreased their dividend for at least 10 years, which is a reliable track record.
- WSM pays out 24.36% of its income as dividend. This is a sustainable payout ratio.
- The dividend of WSM is growing, but earnings are growing more, so the dividend growth is sustainable.
Health Analysis for NYSE:WSM
ChartMill assigns a Health Rating to every stock. This score ranges from 0 to 10 and evaluates the different health aspects like liquidity and solvency, both absolutely, but also relative to the industry peers. NYSE:WSM scores a 8 out of 10:
- An Altman-Z score of 8.01 indicates that WSM is not in any danger for bankruptcy at the moment.
- WSM has a better Altman-Z score (8.01) than 96.58% of its industry peers.
- WSM has no outstanding debt. Therefor its Debt/Equity and Debt/FCF ratios are 0 and belong to the best of the industry.
- The current and quick ratio evaluation for WSM is rather negative, while it does have excellent solvency and profitability. These ratios do not necessarly indicate liquidity issues and need to be evaluated against the specifics of the business.
Profitability Insights: NYSE:WSM
ChartMill assigns a proprietary Profitability Rating to each stock. The score is computed by evaluating various profitability ratios and margins and ranges from 0 to 10. NYSE:WSM was assigned a score of 9 for profitability:
- With an excellent Return On Assets value of 22.04%, WSM belongs to the best of the industry, outperforming 99.15% of the companies in the same industry.
- WSM has a better Return On Equity (57.42%) than 94.87% of its industry peers.
- WSM has a Return On Invested Capital of 33.38%. This is amongst the best in the industry. WSM outperforms 97.44% of its industry peers.
- Measured over the past 3 years, the Average Return On Invested Capital for WSM is significantly above the industry average of 12.43%.
- WSM has a better Profit Margin (14.54%) than 98.29% of its industry peers.
- WSM's Profit Margin has improved in the last couple of years.
- The Operating Margin of WSM (18.50%) is better than 95.73% of its industry peers.
- In the last couple of years the Operating Margin of WSM has grown nicely.
- With a decent Gross Margin value of 46.75%, WSM is doing good in the industry, outperforming 71.79% of the companies in the same industry.
- In the last couple of years the Gross Margin of WSM has grown nicely.
More Best Dividend stocks can be found in our Best Dividend screener.
Our latest full fundamental report of WSM contains the most current fundamental analsysis.
Keep in mind
This is not investing advice! The article highlights some of the observations at the time of writing, but you should always make your own analysis and invest based on your own insights.
188.41
+5.98 (+3.28%)
Find more stocks in the Stock Screener
WSM Latest News and Analysis
 12 days ago - ChartmillExploring NYSE:WSM's dividend characteristics.
Uncovering Dividend Opportunities with WILLIAMS-SONOMA INC (NYSE:WSM).
 19 days ago - ChartmillAnalyzing the Quality Characteristics of WILLIAMS-SONOMA INC (NYSE:WSM).
A fundamental analysis of (NYSE:WSM): Exploring WILLIAMS-SONOMA INC (NYSE:WSM)'s quality characteristics.
