
Unearth the potential of WILLIAMS-SONOMA INC (NYSE:WSM) as a dividend stock recommended by our stock screening tool. NYSE:WSM maintains a robust financial footing and delivers a sustainable dividend. We'll delve into the details below.
ChartMill's Evaluation of Dividend
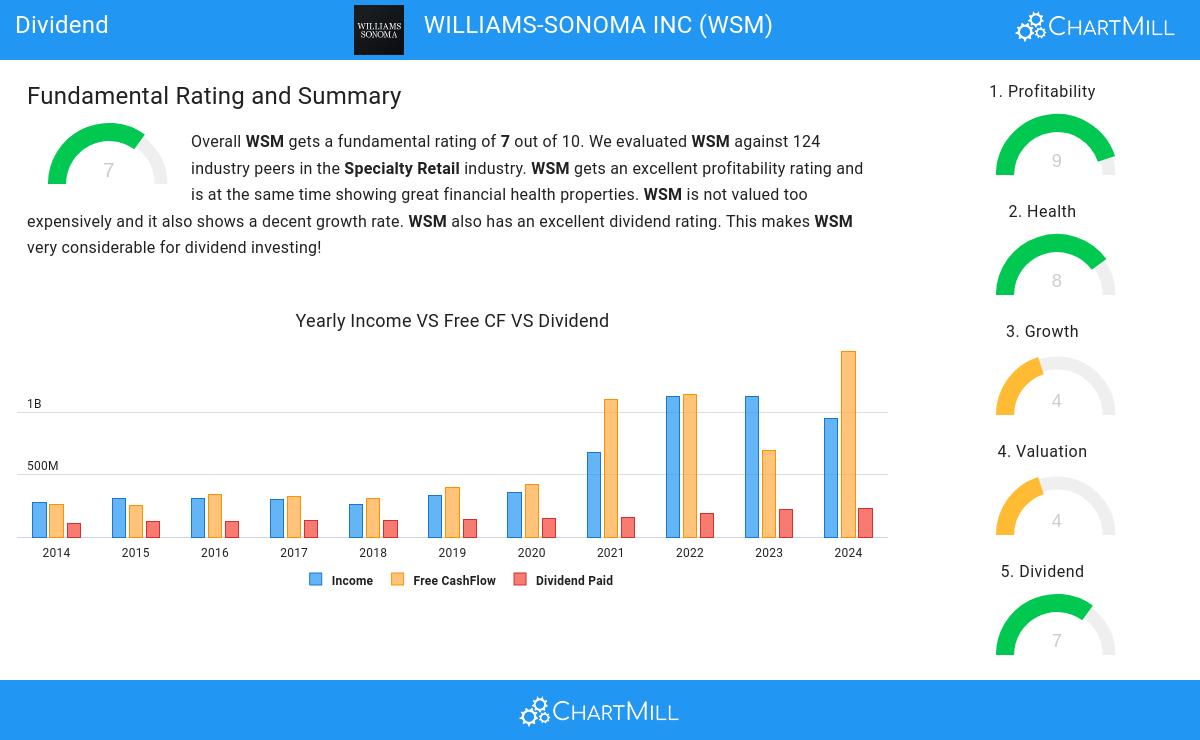
ChartMill assigns a proprietary Dividend Rating to each stock. The score is computed by evaluating various valuation aspects, like the yield, the history, the dividend growth and sustainability. NYSE:WSM was assigned a score of 7 for dividend:
- WSM's Dividend Yield is a higher than the industry average which is at 3.64.
- The dividend of WSM is nicely growing with an annual growth rate of 6.72%!
- WSM has been paying a dividend for at least 10 years, so it has a reliable track record.
- WSM has not decreased their dividend for at least 10 years, which is a reliable track record.
- 23.23% of the earnings are spent on dividend by WSM. This is a low number and sustainable payout ratio.
- The dividend of WSM is growing, but earnings are growing more, so the dividend growth is sustainable.
Assessing Health for NYSE:WSM
ChartMill utilizes a Health Rating to assess stocks, scoring them on a scale of 0 to 10. This rating takes into account a variety of liquidity and solvency ratios, both in absolute terms and in comparison to industry peers. NYSE:WSM has earned a 8 out of 10:
- WSM has an Altman-Z score of 6.95. This indicates that WSM is financially healthy and has little risk of bankruptcy at the moment.
- With an excellent Altman-Z score value of 6.95, WSM belongs to the best of the industry, outperforming 95.90% of the companies in the same industry.
- There is no outstanding debt for WSM. This means it has a Debt/Equity and Debt/FCF ratio of 0 and it is amongst the best of the sector and industry.
- WSM has a better Current ratio (1.56) than 62.30% of its industry peers.
- With a decent Quick ratio value of 0.85, WSM is doing good in the industry, outperforming 68.85% of the companies in the same industry.
- WSM does not score too well on the current and quick ratio evaluation. However, as it has excellent solvency and profitability, these ratios do not necessarly indicate liquidity issues and need to be evaluated against the specifics of the business.
Profitability Examination for NYSE:WSM
ChartMill assigns a Profitability Rating to every stock. This score ranges from 0 to 10 and evaluates the different profitability ratios and margins, both absolutely, but also relative to the industry peers. NYSE:WSM scores a 9 out of 10:
- WSM has a Return On Assets of 20.78%. This is amongst the best in the industry. WSM outperforms 97.54% of its industry peers.
- WSM has a Return On Equity of 48.14%. This is amongst the best in the industry. WSM outperforms 92.62% of its industry peers.
- WSM has a Return On Invested Capital of 30.07%. This is amongst the best in the industry. WSM outperforms 96.72% of its industry peers.
- Measured over the past 3 years, the Average Return On Invested Capital for WSM is significantly above the industry average of 12.30%.
- The last Return On Invested Capital (30.07%) for WSM is well below the 3 year average (34.32%), which needs to be investigated, but indicates that WSM had better years and this may not be a problem.
- Looking at the Profit Margin, with a value of 14.29%, WSM belongs to the top of the industry, outperforming 96.72% of the companies in the same industry.
- WSM's Profit Margin has improved in the last couple of years.
- WSM's Operating Margin of 18.29% is amongst the best of the industry. WSM outperforms 95.90% of its industry peers.
- WSM's Operating Margin has improved in the last couple of years.
- WSM has a Gross Margin of 46.16%. This is in the better half of the industry: WSM outperforms 72.95% of its industry peers.
- In the last couple of years the Gross Margin of WSM has grown nicely.
Our Best Dividend screener lists more Best Dividend stocks and is updated daily.
For an up to date full fundamental analysis you can check the fundamental report of WSM
Keep in mind
This article should in no way be interpreted as advice. The article is based on the observed metrics at the time of writing, but you should always make your own analysis and trade or invest at your own responsibility.