
Why WINNEBAGO INDUSTRIES (NYSE:WGO) qualifies as a good dividend investing stock.
By Mill Chart
Last update: Apr 2, 2025
WINNEBAGO INDUSTRIES (NYSE:WGO) has caught the attention of dividend investors as a stock worth considering. WGO excels in profitability, solvency, and liquidity, all while providing a decent dividend. Let's delve into the details.
Analyzing Dividend Metrics
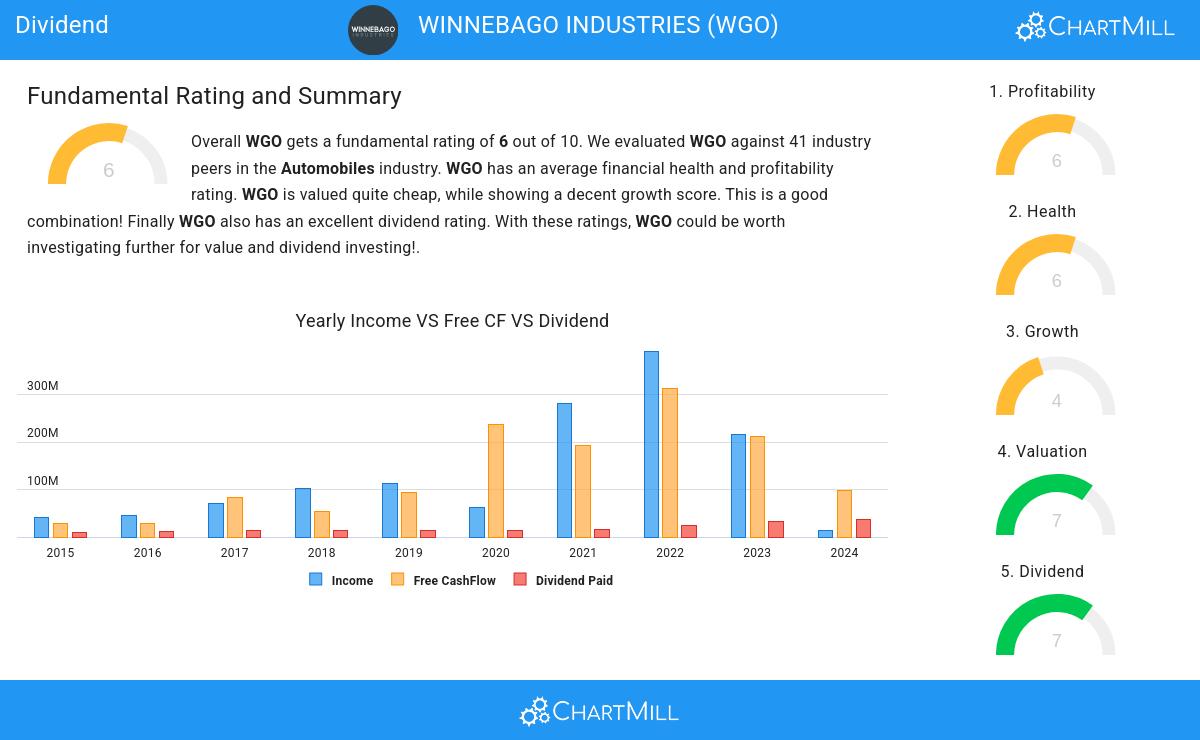
ChartMill assigns a Dividend Rating to each stock, ranging from 0 to 10. This rating is calculated by analyzing various dividend elements, such as yield, historical performance, dividend growth, and sustainability. WGO has been awarded a 7 for its dividend quality:
- Compared to an average industry Dividend Yield of 4.34, WGO pays a better dividend. On top of this WGO pays more dividend than 92.68% of the companies listed in the same industry.
- WGO's Dividend Yield is rather good when compared to the S&P500 average which is at 2.32.
- On average, the dividend of WGO grows each year by 23.63%, which is quite nice.
- WGO has been paying a dividend for at least 10 years, so it has a reliable track record.
- WGO has not decreased their dividend for at least 10 years, which is a reliable track record.
ChartMill's Evaluation of Health
Every stock is evaluated by ChartMill, receiving a Health Rating on a scale of 0 to 10. This assessment considers different health aspects, including liquidity and solvency, both in absolute terms and relative to industry peers. WGO has achieved a 6 out of 10:
- An Altman-Z score of 3.27 indicates that WGO is not in any danger for bankruptcy at the moment.
- WGO's Altman-Z score of 3.27 is amongst the best of the industry. WGO outperforms 87.80% of its industry peers.
- WGO has a better Debt to FCF ratio (8.28) than 90.24% of its industry peers.
- A Debt/Equity ratio of 0.44 indicates that WGO is not too dependend on debt financing.
- A Current Ratio of 2.17 indicates that WGO has no problem at all paying its short term obligations.
- WGO has a Current ratio of 2.17. This is in the better half of the industry: WGO outperforms 78.05% of its industry peers.
Analyzing Profitability Metrics
ChartMill employs its own Profitability Rating system for stock evaluation. This score, ranging from 0 to 10, is derived from an analysis of diverse profitability metrics and margins. In the case of WGO, the assigned 6 is noteworthy for profitability:
- The Return On Assets of WGO (-0.26%) is better than 70.73% of its industry peers.
- The Return On Equity of WGO (-0.47%) is better than 70.73% of its industry peers.
- With a decent Return On Invested Capital value of 2.73%, WGO is doing good in the industry, outperforming 73.17% of the companies in the same industry.
- WGO had an Average Return On Invested Capital over the past 3 years of 13.73%. This is above the industry average of 9.60%.
- The last Return On Invested Capital (2.73%) for WGO is well below the 3 year average (13.73%), which needs to be investigated, but indicates that WGO had better years and this may not be a problem.
- Looking at the Operating Margin, with a value of 2.29%, WGO is in the better half of the industry, outperforming 70.73% of the companies in the same industry.
Our Best Dividend screener lists more Best Dividend stocks and is updated daily.
For an up to date full fundamental analysis you can check the fundamental report of WGO
Keep in mind
Important Note: The content of this article is not intended as trading advice. It is essential to perform your own analysis and exercise caution when making trading decisions. The article presents observations created by automated analysis but does not guarantee any trading or investment outcomes. Always trade responsibly and make independent judgments.
