
NASDAQ:WFRD is probably undervalued for the fundamentals it is displaying.
By Mill Chart
Last update: Feb 5, 2025
Uncover the potential of WEATHERFORD INTERNATIONAL PL (NASDAQ:WFRD) as our stock screener's choice for an undervalued stock. NASDAQ:WFRD maintains a strong financial position and offers an appealing valuation. We'll delve into the specifics below.
What does the Valuation looks like for NASDAQ:WFRD
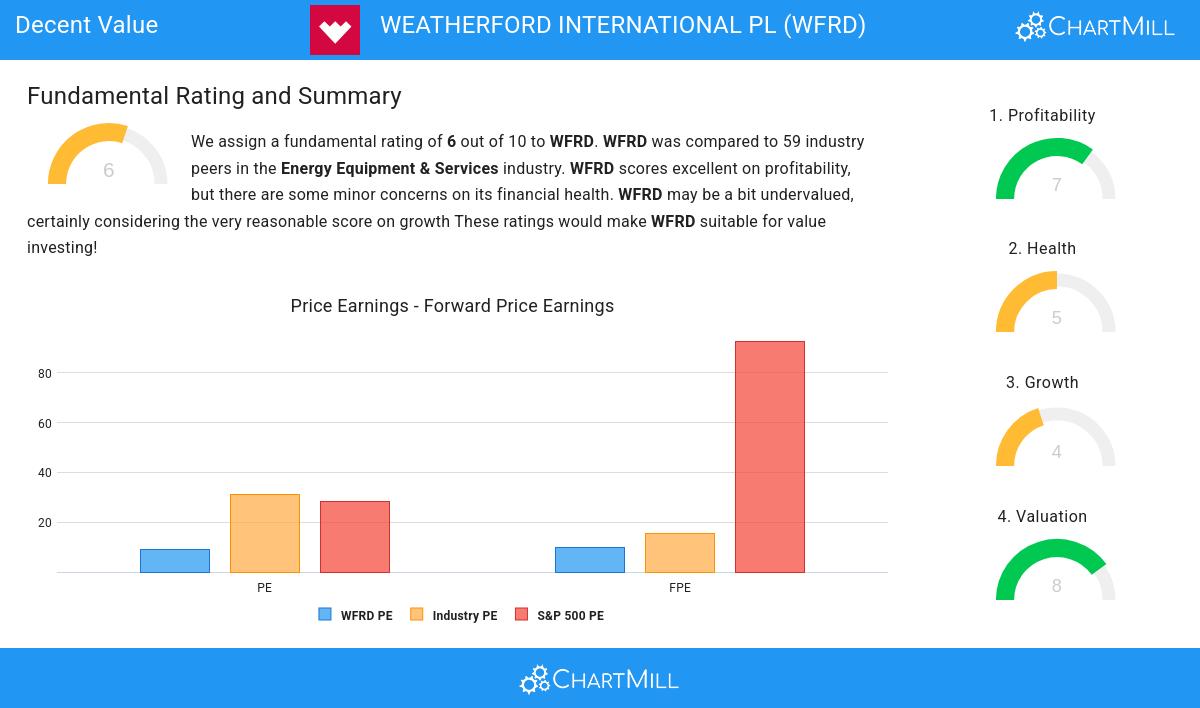
ChartMill employs its own Valuation Rating system for all stocks. This score, ranging from 0 to 10, is determined by evaluating different valuation factors, including price to earnings and free cash flow, both in absolute terms and relative to the market and industry. NASDAQ:WFRD has earned a 8 for valuation:
- A Price/Earnings ratio of 9.13 indicates a reasonable valuation of WFRD.
- Compared to the rest of the industry, the Price/Earnings ratio of WFRD indicates a rather cheap valuation: WFRD is cheaper than 89.66% of the companies listed in the same industry.
- When comparing the Price/Earnings ratio of WFRD to the average of the S&P500 Index (28.47), we can say WFRD is valued rather cheaply.
- WFRD is valuated reasonably with a Price/Forward Earnings ratio of 10.00.
- Compared to the rest of the industry, the Price/Forward Earnings ratio of WFRD indicates a rather cheap valuation: WFRD is cheaper than 84.48% of the companies listed in the same industry.
- WFRD's Price/Forward Earnings ratio indicates a rather cheap valuation when compared to the S&P500 average which is at 92.74.
- Based on the Enterprise Value to EBITDA ratio, WFRD is valued cheaper than 81.03% of the companies in the same industry.
- Compared to the rest of the industry, the Price/Free Cash Flow ratio of WFRD indicates a rather cheap valuation: WFRD is cheaper than 82.76% of the companies listed in the same industry.
- WFRD has a very decent profitability rating, which may justify a higher PE ratio.
Understanding NASDAQ:WFRD's Profitability
Discover ChartMill's exclusive Profitability Rating, a proprietary metric that assesses stocks on a scale of 0 to 10. It takes into consideration various profitability ratios and margins, both in absolute terms and relative to industry peers. Notably, NASDAQ:WFRD has achieved a 7:
- WFRD has a better Return On Assets (10.29%) than 82.76% of its industry peers.
- WFRD has a better Return On Equity (39.70%) than 91.38% of its industry peers.
- With an excellent Return On Invested Capital value of 17.21%, WFRD belongs to the best of the industry, outperforming 96.55% of the companies in the same industry.
- The last Return On Invested Capital (17.21%) for WFRD is above the 3 year average (8.87%), which is a sign of increasing profitability.
- The Profit Margin of WFRD (9.65%) is better than 67.24% of its industry peers.
- WFRD's Operating Margin of 17.42% is fine compared to the rest of the industry. WFRD outperforms 79.31% of its industry peers.
- In the last couple of years the Operating Margin of WFRD has grown nicely.
- WFRD has a better Gross Margin (35.11%) than 68.97% of its industry peers.
- WFRD's Gross Margin has improved in the last couple of years.
Health Assessment of NASDAQ:WFRD
To gauge a stock's financial health, ChartMill utilizes a Health Rating on a scale of 0 to 10. This comprehensive evaluation encompasses liquidity and solvency, both in absolute terms and in comparison to industry peers. NASDAQ:WFRD has earned a 5 out of 10:
- Looking at the Altman-Z score, with a value of 2.39, WFRD is in the better half of the industry, outperforming 68.97% of the companies in the same industry.
- The Debt to FCF ratio of WFRD is 2.53, which is a good value as it means it would take WFRD, 2.53 years of fcf income to pay off all of its debts.
- WFRD has a better Debt to FCF ratio (2.53) than 70.69% of its industry peers.
- A Current Ratio of 2.04 indicates that WFRD has no problem at all paying its short term obligations.
How do we evaluate the Growth for NASDAQ:WFRD?
ChartMill employs its own Growth Rating system for all stocks. This score, ranging from 0 to 10, is derived by evaluating different growth factors, such as EPS and revenue growth, taking into account both past performance and future projections. NASDAQ:WFRD has earned a 4 for growth:
- The Earnings Per Share has grown by an impressive 28.99% over the past year.
- WFRD shows quite a strong growth in Revenue. In the last year, the Revenue has grown by 11.08%.
- The Revenue growth rate is accelerating: in the next years the growth will be better than in the last years.
More Decent Value stocks can be found in our Decent Value screener.
Check the latest full fundamental report of WFRD for a complete fundamental analysis.
Disclaimer
This is not investing advice! The article highlights some of the observations at the time of writing, but you should always make your own analysis and invest based on your own insights.
NASDAQ:WFRD (4/29/2025, 10:07:05 AM)
42.66
+0.54 (+1.28%)
Find more stocks in the Stock Screener
