
NASDAQ:WDAY qualifies as a high growth stock and is consolidating.
By Mill Chart
Last update: Sep 26, 2024
For growth-minded investors, high revenue and EPS growth are key criteria. Today, we'll examine whether WORKDAY INC-CLASS A (NASDAQ:WDAY) fits the bill for growth investing, particularly as it forms a base and hints at a potential breakout. Remember, due diligence is essential, but WORKDAY INC-CLASS A has caught our attention on our screen for growth with base formation. It may warrant additional investigation.
ChartMill's Evaluation of Growth
ChartMill assigns a Growth Rating to every stock. This score ranges from 0 to 10 and evaluates the different growth aspects like EPS and Revenue, both in the past as in the future. NASDAQ:WDAY scores a 8 out of 10:
- The Earnings Per Share has grown by an impressive 39.62% over the past year.
- Measured over the past years, WDAY shows a very strong growth in Earnings Per Share. The EPS has been growing by 33.84% on average per year.
- Looking at the last year, WDAY shows a quite strong growth in Revenue. The Revenue has grown by 17.07% in the last year.
- Measured over the past years, WDAY shows a very strong growth in Revenue. The Revenue has been growing by 20.80% on average per year.
- Based on estimates for the next years, WDAY will show a very strong growth in Earnings Per Share. The EPS will grow by 21.06% on average per year.
- WDAY is expected to show quite a strong growth in Revenue. In the coming years, the Revenue will grow by 15.34% yearly.
Assessing Health Metrics for NASDAQ:WDAY
To gauge a stock's financial health, ChartMill utilizes a Health Rating on a scale of 0 to 10. This comprehensive evaluation encompasses liquidity and solvency, both in absolute terms and in comparison to industry peers. NASDAQ:WDAY has earned a 7 out of 10:
- An Altman-Z score of 5.68 indicates that WDAY is not in any danger for bankruptcy at the moment.
- WDAY's Altman-Z score of 5.68 is fine compared to the rest of the industry. WDAY outperforms 69.04% of its industry peers.
- WDAY has a debt to FCF ratio of 1.39. This is a very positive value and a sign of high solvency as it would only need 1.39 years to pay back of all of its debts.
- The Debt to FCF ratio of WDAY (1.39) is better than 70.82% of its industry peers.
- WDAY has a Debt/Equity ratio of 0.36. This is a healthy value indicating a solid balance between debt and equity.
- Although WDAY does not score too well on debt/equity it has very limited outstanding debt, which is well covered by the FCF. We will not put too much weight on the debt/equity number as it may be because of low equity, which could be a consequence of a share buyback program for instance. This needs to be investigated.
- A Current Ratio of 2.04 indicates that WDAY has no problem at all paying its short term obligations.
- The Current ratio of WDAY (2.04) is better than 61.57% of its industry peers.
- A Quick Ratio of 2.04 indicates that WDAY has no problem at all paying its short term obligations.
- WDAY has a Quick ratio of 2.04. This is in the better half of the industry: WDAY outperforms 61.57% of its industry peers.
Profitability Examination for NASDAQ:WDAY
ChartMill utilizes a Profitability Rating to assess stocks, scoring them on a scale of 0 to 10. This rating takes into account a variety of profitability ratios and margins, both in absolute terms and in comparison to industry peers. NASDAQ:WDAY has earned a 6 out of 10:
- With an excellent Return On Assets value of 9.49%, WDAY belongs to the best of the industry, outperforming 86.83% of the companies in the same industry.
- Looking at the Return On Equity, with a value of 18.47%, WDAY belongs to the top of the industry, outperforming 88.61% of the companies in the same industry.
- The Return On Invested Capital of WDAY (2.30%) is better than 71.53% of its industry peers.
- Looking at the Profit Margin, with a value of 19.60%, WDAY belongs to the top of the industry, outperforming 87.19% of the companies in the same industry.
- WDAY has a Operating Margin of 4.34%. This is in the better half of the industry: WDAY outperforms 70.46% of its industry peers.
- With a decent Gross Margin value of 75.77%, WDAY is doing good in the industry, outperforming 70.11% of the companies in the same industry.
Why is NASDAQ:WDAY a setup?
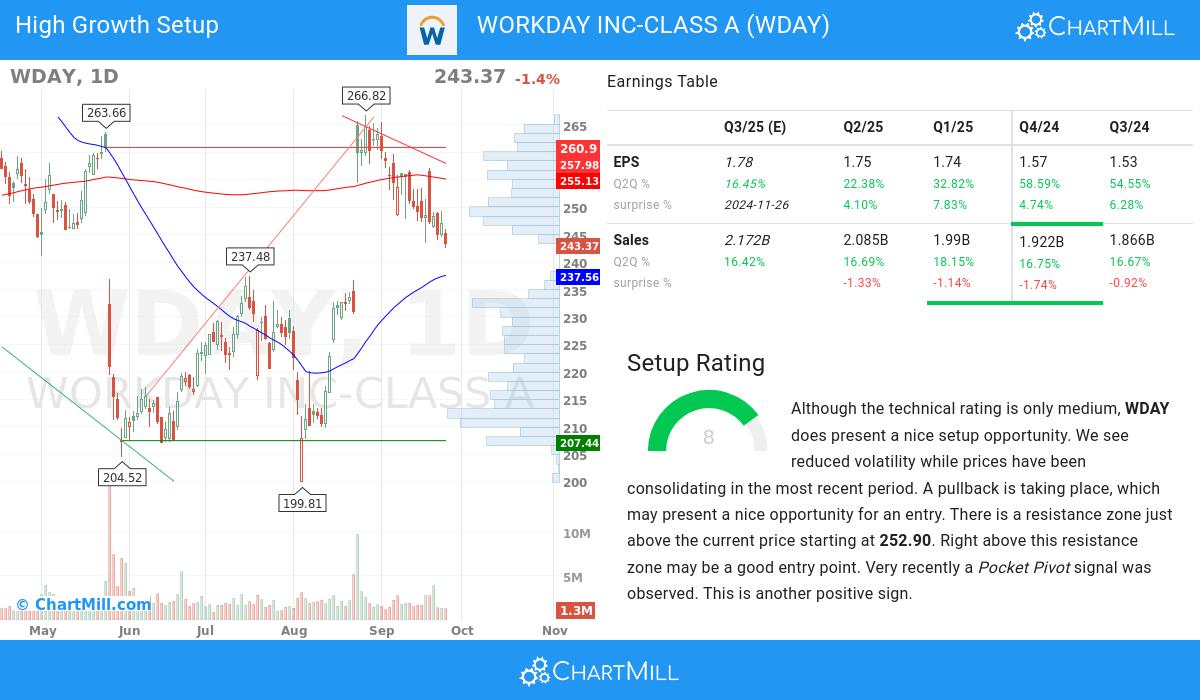
ChartMill takes into account not only the Technical Rating but also assigns a Setup Rating to each stock. This rating, on a scale of 0 to 10, reflects the degree of consolidation observed based on short-term technical indicators. Currently, NASDAQ:WDAY exhibits a 8 setup rating, indicating its consolidation status in recent days and weeks.
Although the technical rating is only medium, WDAY does present a nice setup opportunity. We see reduced volatility while prices have been consolidating in the most recent period. A pullback is taking place, which may present a nice opportunity for an entry. There is a resistance zone just above the current price starting at 252.90. Right above this resistance zone may be a good entry point. Another positive sign is the recent Pocket Pivot signal.
Our Strong Growth screener lists more Strong Growth stocks and is updated daily.
Check the latest full fundamental report of WDAY for a complete fundamental analysis.
For an up to date full technical analysis you can check the technical report of WDAY
Disclaimer
Important Note: The content of this article is not intended as trading advice. It is essential to perform your own analysis and exercise caution when making trading decisions. The article presents observations created by automated analysis but does not guarantee any trading or investment outcomes. Always trade responsibly and make independent judgments.
NASDAQ:WDAY (4/17/2025, 10:58:07 AM)
222.415
-5.3 (-2.33%)
Find more stocks in the Stock Screener
WDAY Latest News and Analysis
 17 days ago - ChartmillWhat's going on in today's session: S&P500 movers
Stay informed about the performance of the S&P500 index one hour before the close of the markets on Monday. Uncover the top gainers and losers in today's session for valuable insights.
 20 days ago - ChartmillTop gainers and losers in the S&P500 index during Friday's after-hours session.
The regular session of the US market on Friday is now over, but let's get a preview of the after-hours session and explore the top S&P500 gainers and losers driving the post-market movements.
