
Groth investors are looking for stocks showing high revenue and EPS growth. We will have a look here to see if WORKDAY INC-CLASS A (NASDAQ:WDAY) is suited for growth investing, while it is forming a base and may be ready to breakout. Investors should of course do their own research, but we spotted WORKDAY INC-CLASS A showing up in our growth with base formation screen, so it may be worth spending some more time on it.
Assessing Growth Metrics for NASDAQ:WDAY
ChartMill employs its own Growth Rating system for all stocks. This score, ranging from 0 to 10, is derived by evaluating different growth factors, such as EPS and revenue growth, taking into account both past performance and future projections. NASDAQ:WDAY has earned a 8 for growth:
- The Earnings Per Share has grown by an impressive 39.62% over the past year.
- The Earnings Per Share has been growing by 33.84% on average over the past years. This is a very strong growth
- Looking at the last year, WDAY shows a quite strong growth in Revenue. The Revenue has grown by 17.07% in the last year.
- The Revenue has been growing by 20.80% on average over the past years. This is a very strong growth!
- Based on estimates for the next years, WDAY will show a very strong growth in Earnings Per Share. The EPS will grow by 21.06% on average per year.
- The Revenue is expected to grow by 15.34% on average over the next years. This is quite good.
A Closer Look at Health for NASDAQ:WDAY
To gauge a stock's financial health, ChartMill utilizes a Health Rating on a scale of 0 to 10. This comprehensive evaluation encompasses liquidity and solvency, both in absolute terms and in comparison to industry peers. NASDAQ:WDAY has earned a 7 out of 10:
- An Altman-Z score of 5.99 indicates that WDAY is not in any danger for bankruptcy at the moment.
- WDAY's Altman-Z score of 5.99 is fine compared to the rest of the industry. WDAY outperforms 74.56% of its industry peers.
- WDAY has a debt to FCF ratio of 1.39. This is a very positive value and a sign of high solvency as it would only need 1.39 years to pay back of all of its debts.
- Looking at the Debt to FCF ratio, with a value of 1.39, WDAY is in the better half of the industry, outperforming 70.67% of the companies in the same industry.
- WDAY has a Debt/Equity ratio of 0.36. This is a healthy value indicating a solid balance between debt and equity.
- Although WDAY does not score too well on debt/equity it has very limited outstanding debt, which is well covered by the FCF. We will not put too much weight on the debt/equity number as it may be because of low equity, which could be a consequence of a share buyback program for instance. This needs to be investigated.
- WDAY has a Current Ratio of 2.04. This indicates that WDAY is financially healthy and has no problem in meeting its short term obligations.
- WDAY has a better Current ratio (2.04) than 62.54% of its industry peers.
- A Quick Ratio of 2.04 indicates that WDAY has no problem at all paying its short term obligations.
- WDAY has a Quick ratio of 2.04. This is in the better half of the industry: WDAY outperforms 62.54% of its industry peers.
Analyzing Profitability Metrics
ChartMill's Profitability Rating offers a unique perspective on stock analysis, providing scores from 0 to 10. These ratings consider a wide range of profitability metrics and margins, both in comparison to industry peers and on their own merits. For NASDAQ:WDAY, the assigned 6 is a significant indicator of profitability:
- Looking at the Return On Assets, with a value of 9.49%, WDAY belongs to the top of the industry, outperforming 87.28% of the companies in the same industry.
- WDAY has a Return On Equity of 18.47%. This is amongst the best in the industry. WDAY outperforms 88.69% of its industry peers.
- WDAY has a Return On Invested Capital of 2.30%. This is in the better half of the industry: WDAY outperforms 71.38% of its industry peers.
- WDAY's Profit Margin of 19.60% is amongst the best of the industry. WDAY outperforms 87.63% of its industry peers.
- WDAY has a better Operating Margin (4.34%) than 71.38% of its industry peers.
- With a decent Gross Margin value of 75.77%, WDAY is doing good in the industry, outperforming 70.32% of the companies in the same industry.
Looking at the Setup
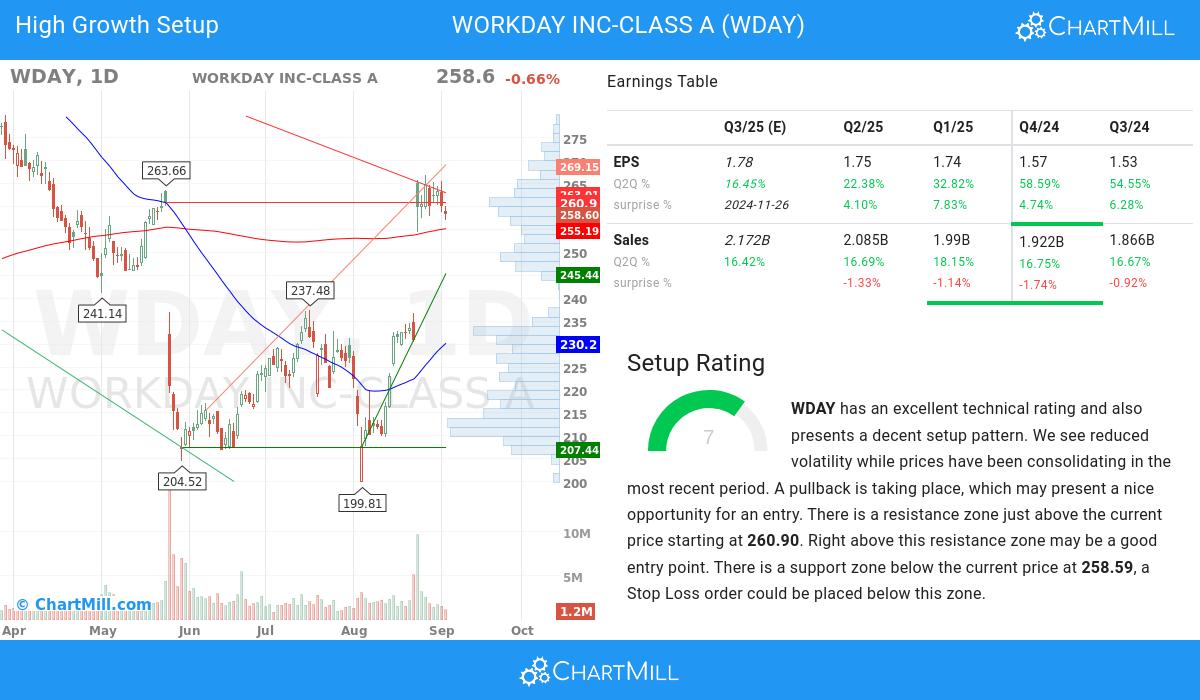
Alongside the Technical Rating, ChartMill assigns a Setup Rating to evaluate the consolidation level of a stock. This rating, ranging from 0 to 10, is updated daily and considers various short-term technical indicators. The current setup rating for NASDAQ:WDAY is 7:
WDAY has an excellent technical rating and also presents a decent setup pattern. Prices have been consolidating lately and the volatility has been reduced. A pullback is taking place, which may present a nice opportunity for an entry. There is a resistance zone just above the current price starting at 260.90. Right above this resistance zone may be a good entry point. There is a support zone below the current price at 258.59, a Stop Loss order could be placed below this zone.
Every day, new Strong Growth stocks can be found on ChartMill in our Strong Growth screener.
For an up to date full fundamental analysis you can check the fundamental report of WDAY
Check the latest full technical report of WDAY for a complete technical analysis.
Keep in mind
This article should in no way be interpreted as advice. The article is based on the observed metrics at the time of writing, but you should always make your own analysis and trade or invest at your own responsibility.