
When you look at WESCO INTERNATIONAL INC (NYSE:WCC), it's hard to ignore the strong fundamentals, especially considering its likely undervaluation.
By Mill Chart
Last update: Apr 1, 2025
Uncover the potential of WESCO INTERNATIONAL INC (NYSE:WCC) as our stock screener's choice for an undervalued stock. WCC maintains a strong financial position and offers an appealing valuation. We'll delve into the specifics below.
Deciphering WCC's Valuation Rating
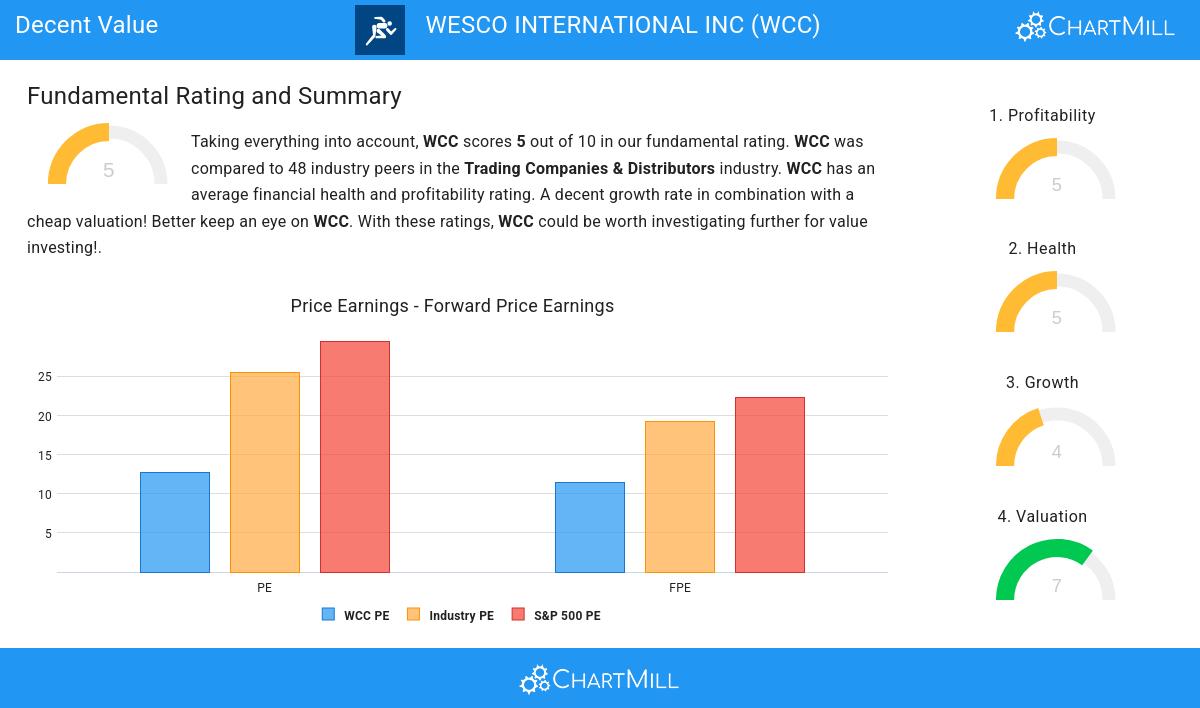
To assess a stock's valuation, ChartMill utilizes a Valuation Rating on a scale of 0 to 10. This comprehensive assessment considers various valuation aspects, comparing price to earnings and cash flows, while factoring in profitability and growth. WCC has achieved a 7 out of 10:
- WCC's Price/Earnings ratio is rather cheap when compared to the industry. WCC is cheaper than 81.25% of the companies in the same industry.
- When comparing the Price/Earnings ratio of WCC to the average of the S&P500 Index (29.51), we can say WCC is valued rather cheaply.
- A Price/Forward Earnings ratio of 11.38 indicates a reasonable valuation of WCC.
- Based on the Price/Forward Earnings ratio, WCC is valued cheaper than 83.33% of the companies in the same industry.
- The average S&P500 Price/Forward Earnings ratio is at 22.30. WCC is valued slightly cheaper when compared to this.
- WCC's Enterprise Value to EBITDA ratio is a bit cheaper when compared to the industry. WCC is cheaper than 70.83% of the companies in the same industry.
- Compared to the rest of the industry, the Price/Free Cash Flow ratio of WCC indicates a rather cheap valuation: WCC is cheaper than 93.75% of the companies listed in the same industry.
- A more expensive valuation may be justified as WCC's earnings are expected to grow with 16.41% in the coming years.
Exploring WCC's Profitability
Discover ChartMill's exclusive Profitability Rating, a proprietary metric that assesses stocks on a scale of 0 to 10. It takes into consideration various profitability ratios and margins, both in absolute terms and relative to industry peers. Notably, WCC has achieved a 5:
- WCC has a Return On Invested Capital of 8.68%. This is in the better half of the industry: WCC outperforms 62.50% of its industry peers.
- In the last couple of years the Profit Margin of WCC has grown nicely.
- In the last couple of years the Operating Margin of WCC has grown nicely.
- WCC's Gross Margin has improved in the last couple of years.
Assessing Health for WCC
Every stock is evaluated by ChartMill, receiving a Health Rating on a scale of 0 to 10. This assessment considers different health aspects, including liquidity and solvency, both in absolute terms and relative to industry peers. WCC has achieved a 5 out of 10:
- An Altman-Z score of 3.00 indicates that WCC is not in any danger for bankruptcy at the moment.
- With a decent Debt to FCF ratio value of 5.03, WCC is doing good in the industry, outperforming 62.50% of the companies in the same industry.
- WCC has a Current Ratio of 2.20. This indicates that WCC is financially healthy and has no problem in meeting its short term obligations.
Assessing Growth Metrics for WCC
ChartMill assigns a proprietary Growth Rating to each stock. The score is computed by evaluating various growth aspects, like EPS and revenue growth. We take into account the history as well as the estimated future numbers. WCC was assigned a score of 4 for growth:
- Measured over the past years, WCC shows a quite strong growth in Earnings Per Share. The EPS has been growing by 18.60% on average per year.
- Measured over the past years, WCC shows a very strong growth in Revenue. The Revenue has been growing by 21.15% on average per year.
- Based on estimates for the next years, WCC will show a quite strong growth in Earnings Per Share. The EPS will grow by 8.23% on average per year.
Every day, new Decent Value stocks can be found on ChartMill in our Decent Value screener.
For an up to date full fundamental analysis you can check the fundamental report of WCC
Disclaimer
This article should in no way be interpreted as advice. The article is based on the observed metrics at the time of writing, but you should always make your own analysis and trade or invest at your own responsibility.
NYSE:WCC (4/24/2025, 11:22:03 AM)
158.725
+4.53 (+2.94%)
Find more stocks in the Stock Screener
