NYSE:VRT stands out as a growth opportunity that won't break the bank.
By Mill Chart
Last update: Oct 7, 2024
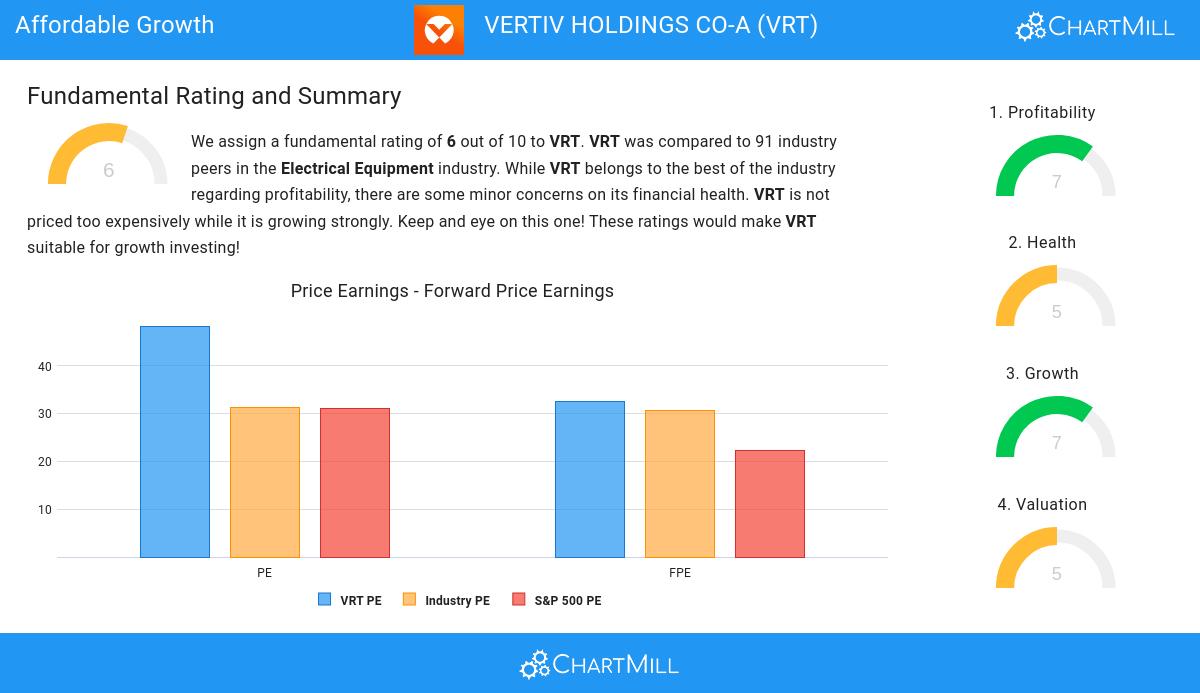
Our stock screener has spotted VERTIV HOLDINGS CO-A (NYSE:VRT) as a growth stock which is not overvalued. NYSE:VRT is scoring great on several growth aspects while it also shows decent health and profitability. At the same time it remains remains attractively priced. We'll dive into each aspect below.
Growth Analysis for NYSE:VRT
ChartMill assigns a Growth Rating to every stock. This score ranges from 0 to 10 and evaluates the different growth aspects like EPS and Revenue, both in the past as in the future. NYSE:VRT scores a 7 out of 10:
- The Earnings Per Share has grown by an impressive 80.17% over the past year.
- The Earnings Per Share has been growing by 81.80% on average over the past years. This is a very strong growth
- The Revenue has grown by 12.66% in the past year. This is quite good.
- The Revenue has been growing by 16.23% on average over the past years. This is quite good.
- Based on estimates for the next years, VRT will show a very strong growth in Earnings Per Share. The EPS will grow by 27.21% on average per year.
- Based on estimates for the next years, VRT will show a quite strong growth in Revenue. The Revenue will grow by 8.99% on average per year.
A Closer Look at Valuation for NYSE:VRT
ChartMill assigns a Valuation Rating to every stock. This score ranges from 0 to 10 and evaluates the different valuation aspects and compares the price to earnings and cash flows, while taking into account profitability and growth. NYSE:VRT scores a 5 out of 10:
- VRT's Price/Earnings ratio is a bit cheaper when compared to the industry. VRT is cheaper than 68.54% of the companies in the same industry.
- VRT's Price/Forward Earnings ratio is a bit cheaper when compared to the industry. VRT is cheaper than 67.42% of the companies in the same industry.
- 67.42% of the companies in the same industry are more expensive than VRT, based on the Enterprise Value to EBITDA ratio.
- Compared to the rest of the industry, the Price/Free Cash Flow ratio of VRT indicates a somewhat cheap valuation: VRT is cheaper than 71.91% of the companies listed in the same industry.
- VRT has a very decent profitability rating, which may justify a higher PE ratio.
- VRT's earnings are expected to grow with 31.41% in the coming years. This may justify a more expensive valuation.
Looking at the Health
ChartMill employs a unique Health Rating system for all stocks. This rating, ranging from 0 to 10, is determined by analyzing various liquidity and solvency ratios. For NYSE:VRT, the assigned 5 for health provides valuable insights:
- VRT has an Altman-Z score of 5.01. This indicates that VRT is financially healthy and has little risk of bankruptcy at the moment.
- VRT's Altman-Z score of 5.01 is amongst the best of the industry. VRT outperforms 86.52% of its industry peers.
- VRT has a debt to FCF ratio of 3.05. This is a good value and a sign of high solvency as VRT would need 3.05 years to pay back of all of its debts.
- VRT's Debt to FCF ratio of 3.05 is fine compared to the rest of the industry. VRT outperforms 77.53% of its industry peers.
Looking at the Profitability
ChartMill utilizes a Profitability Rating to assess stocks, scoring them on a scale of 0 to 10. This rating takes into account a variety of profitability ratios and margins, both in absolute terms and in comparison to industry peers. NYSE:VRT has earned a 7 out of 10:
- VRT has a better Return On Assets (6.15%) than 82.02% of its industry peers.
- VRT's Return On Equity of 32.45% is amongst the best of the industry. VRT outperforms 96.63% of its industry peers.
- VRT has a better Return On Invested Capital (14.29%) than 93.26% of its industry peers.
- The 3 year average ROIC (5.70%) for VRT is below the current ROIC(14.29%), indicating increased profibility in the last year.
- With an excellent Profit Margin value of 6.93%, VRT belongs to the best of the industry, outperforming 83.15% of the companies in the same industry.
- VRT has a better Operating Margin (15.11%) than 87.64% of its industry peers.
- In the last couple of years the Operating Margin of VRT has grown nicely.
- Looking at the Gross Margin, with a value of 36.37%, VRT belongs to the top of the industry, outperforming 88.76% of the companies in the same industry.
More Affordable Growth stocks can be found in our Affordable Growth screener.
Our latest full fundamental report of VRT contains the most current fundamental analsysis.
Keep in mind
Important Note: The content of this article is not intended as trading advice. It is essential to perform your own analysis and exercise caution when making trading decisions. The article presents observations created by automated analysis but does not guarantee any trading or investment outcomes. Always trade responsibly and make independent judgments.
NYSE:VRT (4/24/2025, 3:02:07 PM)
83.98
+5.98 (+7.67%)
Find more stocks in the Stock Screener
VRT Latest News and Analysis
 14 days ago - ChartmillFor those who appreciate growth without the sticker shock, VERTIV HOLDINGS CO-A (NYSE:VRT) is worth considering.
VERTIV HOLDINGS CO-A was identified as a growth stock that isn't overvalued. NYSE:VRT is excelling in various growth indicators while maintaining a solid financial footing.
