
Here's VERTIV HOLDINGS CO-A (NYSE:VRT) for you, a growth stock our stock screener believes is undervalued. NYSE:VRT is scoring impressively in terms of growth while demonstrating strong financials. On top of that, it remains attractively priced. Let's break it down further.
Looking at the Growth
ChartMill employs its own Growth Rating system for all stocks. This score, ranging from 0 to 10, is derived by evaluating different growth factors, such as EPS and revenue growth, taking into account both past performance and future projections. NYSE:VRT has earned a 7 for growth:
- The Earnings Per Share has grown by an impressive 80.17% over the past year.
- The Earnings Per Share has been growing by 81.80% on average over the past years. This is a very strong growth
- Looking at the last year, VRT shows a quite strong growth in Revenue. The Revenue has grown by 12.66% in the last year.
- The Revenue has been growing by 16.23% on average over the past years. This is quite good.
- The Earnings Per Share is expected to grow by 27.21% on average over the next years. This is a very strong growth
- Based on estimates for the next years, VRT will show a quite strong growth in Revenue. The Revenue will grow by 8.99% on average per year.
Analyzing Valuation Metrics
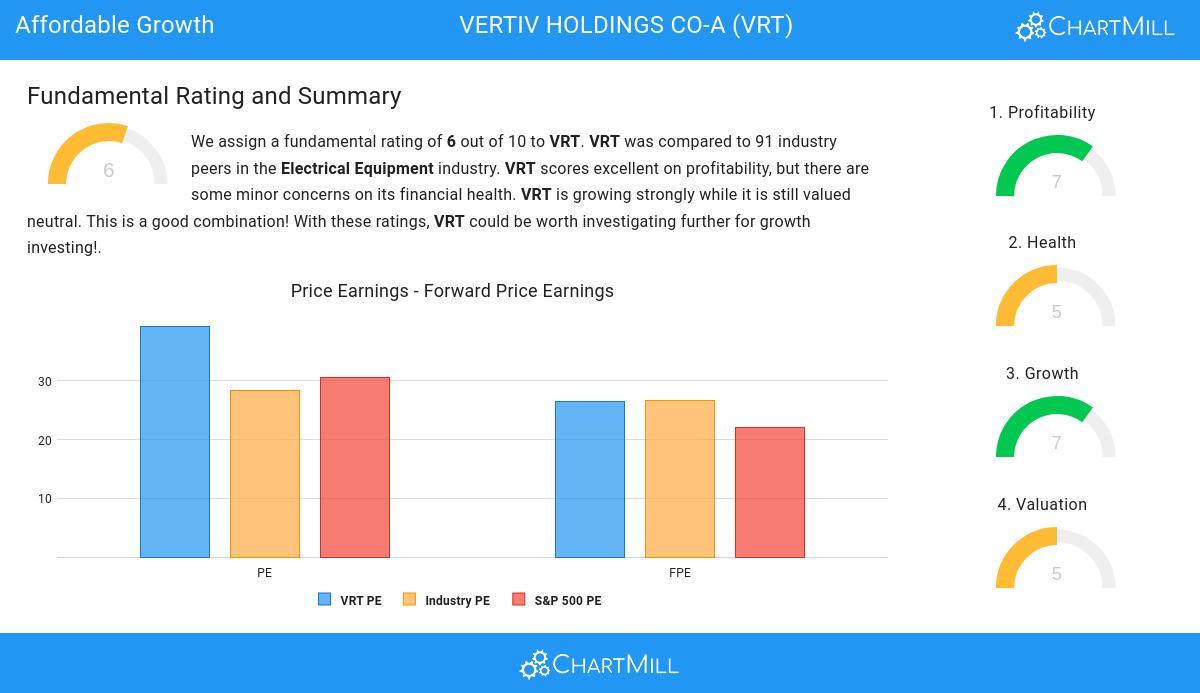
ChartMill assigns a proprietary Valuation Rating to each stock. The score is computed by evaluating various valuation aspects, like price to earnings and free cash flow, both absolutely as relative to the market and industry. NYSE:VRT was assigned a score of 5 for valuation:
- VRT's Price/Earnings ratio is a bit cheaper when compared to the industry. VRT is cheaper than 68.89% of the companies in the same industry.
- Based on the Price/Forward Earnings ratio, VRT is valued a bit cheaper than 68.89% of the companies in the same industry.
- Based on the Enterprise Value to EBITDA ratio, VRT is valued a bit cheaper than 67.78% of the companies in the same industry.
- Based on the Price/Free Cash Flow ratio, VRT is valued a bit cheaper than 73.33% of the companies in the same industry.
- VRT's low PEG Ratio(NY), which compensates the Price/Earnings for growth, indicates a rather cheap valuation of the company.
- VRT has a very decent profitability rating, which may justify a higher PE ratio.
- A more expensive valuation may be justified as VRT's earnings are expected to grow with 31.41% in the coming years.
Looking at the Health
ChartMill employs its own Health Rating for stock assessment. This rating, ranging from 0 to 10, is calculated by examining various liquidity and solvency ratios. In the case of NYSE:VRT, the assigned 5 reflects its health status:
- VRT has an Altman-Z score of 4.34. This indicates that VRT is financially healthy and has little risk of bankruptcy at the moment.
- VRT has a better Altman-Z score (4.34) than 81.11% of its industry peers.
- VRT has a debt to FCF ratio of 3.05. This is a good value and a sign of high solvency as VRT would need 3.05 years to pay back of all of its debts.
- VRT has a better Debt to FCF ratio (3.05) than 77.78% of its industry peers.
Assessing Profitability for NYSE:VRT
ChartMill utilizes a Profitability Rating to assess stocks, scoring them on a scale of 0 to 10. This rating takes into account a variety of profitability ratios and margins, both in absolute terms and in comparison to industry peers. NYSE:VRT has earned a 7 out of 10:
- With an excellent Return On Assets value of 6.15%, VRT belongs to the best of the industry, outperforming 81.11% of the companies in the same industry.
- The Return On Equity of VRT (32.45%) is better than 96.67% of its industry peers.
- Looking at the Return On Invested Capital, with a value of 14.29%, VRT belongs to the top of the industry, outperforming 93.33% of the companies in the same industry.
- The 3 year average ROIC (5.70%) for VRT is below the current ROIC(14.29%), indicating increased profibility in the last year.
- The Profit Margin of VRT (6.93%) is better than 82.22% of its industry peers.
- VRT has a better Operating Margin (15.11%) than 87.78% of its industry peers.
- VRT's Operating Margin has improved in the last couple of years.
- VRT has a Gross Margin of 36.37%. This is amongst the best in the industry. VRT outperforms 88.89% of its industry peers.
Every day, new Affordable Growth stocks can be found on ChartMill in our Affordable Growth screener.
Our latest full fundamental report of VRT contains the most current fundamental analsysis.
Disclaimer
This article should in no way be interpreted as advice. The article is based on the observed metrics at the time of writing, but you should always make your own analysis and trade or invest at your own responsibility.


