
VERINT SYSTEMS INC (NASDAQ:VRNT) is probably undervalued for the fundamentals it is displaying.
By Mill Chart
Last update: Mar 8, 2025
Our stock screener has singled out VERINT SYSTEMS INC (NASDAQ:VRNT) as a stellar value proposition. NASDAQ:VRNT not only scores well in profitability, solvency, and liquidity but also maintains a very reasonable price point. We'll explore this further.
Analyzing Valuation Metrics
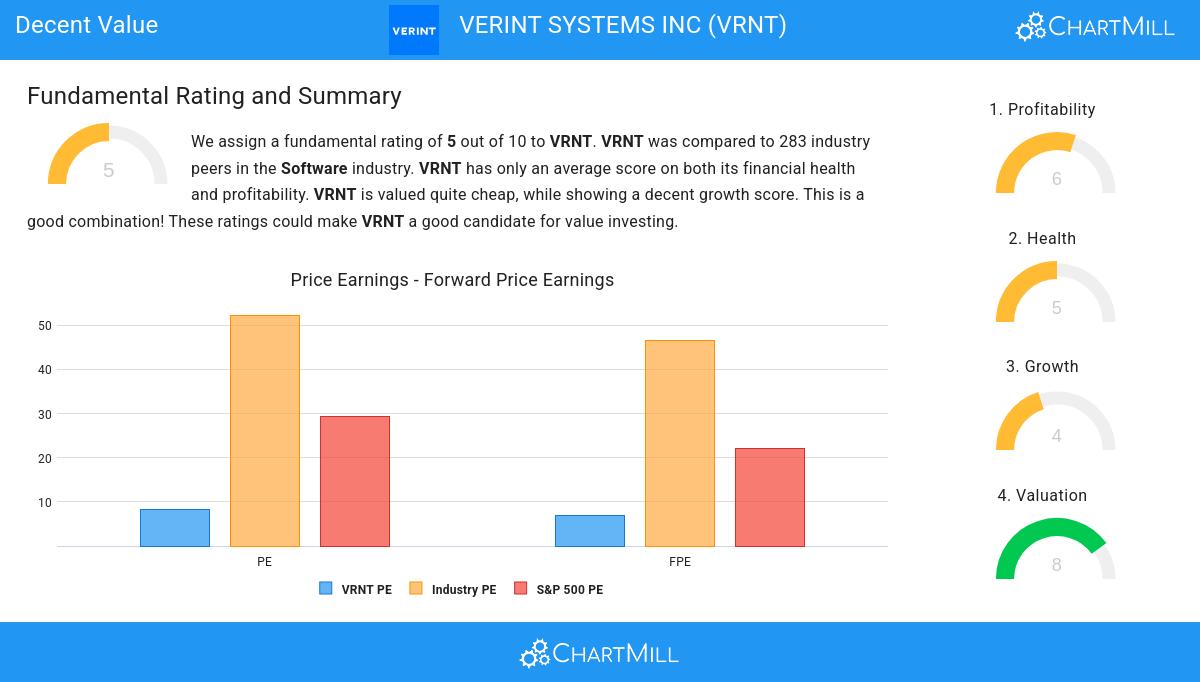
ChartMill provides a Valuation Rating to every stock, ranging from 0 to 10. This rating assesses various valuation aspects, comparing price to earnings and cash flows, while considering factors like profitability and growth. NASDAQ:VRNT boasts a 8 out of 10:
- A Price/Earnings ratio of 8.26 indicates a reasonable valuation of VRNT.
- 93.99% of the companies in the same industry are more expensive than VRNT, based on the Price/Earnings ratio.
- Compared to an average S&P500 Price/Earnings ratio of 29.35, VRNT is valued rather cheaply.
- With a Price/Forward Earnings ratio of 6.99, the valuation of VRNT can be described as very cheap.
- Based on the Price/Forward Earnings ratio, VRNT is valued cheaply inside the industry as 96.47% of the companies are valued more expensively.
- Compared to an average S&P500 Price/Forward Earnings ratio of 22.10, VRNT is valued rather cheaply.
- 91.52% of the companies in the same industry are more expensive than VRNT, based on the Enterprise Value to EBITDA ratio.
- Compared to the rest of the industry, the Price/Free Cash Flow ratio of VRNT indicates a rather cheap valuation: VRNT is cheaper than 95.41% of the companies listed in the same industry.
- VRNT's low PEG Ratio(NY), which compensates the Price/Earnings for growth, indicates a rather cheap valuation of the company.
- VRNT has a very decent profitability rating, which may justify a higher PE ratio.
Looking at the Profitability
ChartMill employs its own Profitability Rating system for stock evaluation. This score, ranging from 0 to 10, is derived from an analysis of diverse profitability metrics and margins. In the case of NASDAQ:VRNT, the assigned 6 is noteworthy for profitability:
- The Return On Assets of VRNT (2.66%) is better than 70.32% of its industry peers.
- VRNT has a Return On Equity of 4.54%. This is in the better half of the industry: VRNT outperforms 72.44% of its industry peers.
- With a decent Return On Invested Capital value of 3.91%, VRNT is doing good in the industry, outperforming 73.85% of the companies in the same industry.
- The 3 year average ROIC (2.85%) for VRNT is below the current ROIC(3.91%), indicating increased profibility in the last year.
- VRNT has a better Profit Margin (6.49%) than 72.08% of its industry peers.
- The Operating Margin of VRNT (10.01%) is better than 77.74% of its industry peers.
- VRNT's Gross Margin has improved in the last couple of years.
Assessing Health Metrics for NASDAQ:VRNT
To gauge a stock's financial health, ChartMill utilizes a Health Rating on a scale of 0 to 10. This comprehensive evaluation encompasses liquidity and solvency, both in absolute terms and in comparison to industry peers. NASDAQ:VRNT has earned a 5 out of 10:
- The Debt to FCF ratio of VRNT is 2.94, which is a good value as it means it would take VRNT, 2.94 years of fcf income to pay off all of its debts.
- VRNT's Debt to FCF ratio of 2.94 is fine compared to the rest of the industry. VRNT outperforms 62.54% of its industry peers.
- VRNT has a Debt/Equity ratio of 0.31. This is a healthy value indicating a solid balance between debt and equity.
Deciphering NASDAQ:VRNT's Growth Rating
Every stock receives a Growth Rating from ChartMill, ranging from 0 to 10. This rating assesses various growth aspects, including historical and projected EPS and revenue growth. NASDAQ:VRNT boasts a 4 out of 10:
- VRNT shows a strong growth in Earnings Per Share. In the last year, the EPS has been growing by 11.62%, which is quite good.
- Based on estimates for the next years, VRNT will show a quite strong growth in Earnings Per Share. The EPS will grow by 12.52% on average per year.
- When comparing the EPS growth rate of the last years to the growth rate of the upcoming years, we see that the growth is accelerating.
- The Revenue growth rate is accelerating: in the next years the growth will be better than in the last years.
Every day, new Decent Value stocks can be found on ChartMill in our Decent Value screener.
Our latest full fundamental report of VRNT contains the most current fundamental analsysis.
Disclaimer
This article should in no way be interpreted as advice. The article is based on the observed metrics at the time of writing, but you should always make your own analysis and trade or invest at your own responsibility.
