
Unlocking the Growth Potential of NASDAQ:VNOM.
By Mill Chart
Last update: Sep 17, 2024
Groth investors are looking for stocks showing high revenue and EPS growth. We will have a look here to see if VIPER ENERGY INC (NASDAQ:VNOM) is suited for growth investing. Investors should of course do their own research, but we spotted VIPER ENERGY INC showing up in our CANSLIM growth screen, so it may be worth spending some more time on it.
Looking into the canslim metrics of VIPER ENERGY INC
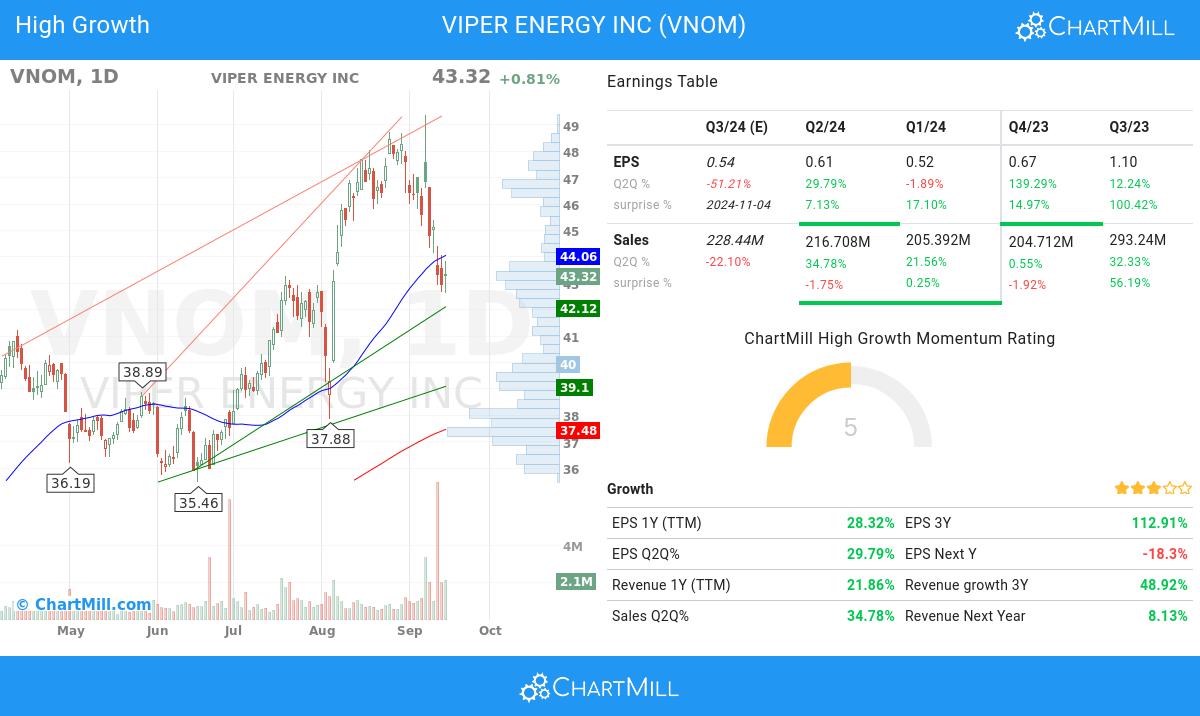
- With a favorable trend in its quarter-to-quarter (Q2Q) earnings per share (EPS), VIPER ENERGY INC highlights its ability to generate increasing profitability, showcasing a 29.79% growth.
- VIPER ENERGY INC has achieved 34.78% growth in its revenue over the previous quarter, signaling positive momentum in its financial performance and potential market opportunities.
- The EPS of VIPER ENERGY INC has shown consistent growth over a 3-year period, indicating the company's ability to generate increasing earnings over time.
- The Return on Equity (ROE) of VIPER ENERGY INC stands at 21.61%, reflecting the company's strong profitability and effective utilization of shareholder equity. This metric signifies the company's ability to generate returns for its investors.
- The Relative Strength (RS) of VIPER ENERGY INC has consistently been strong, with a current 90.74 rating. This indicates the stock's ability to exhibit relative price outperformance and reflects its competitive strength. VIPER ENERGY INC demonstrates promising potential for sustained price momentum.
- Maintaining a Debt-to-Equity ratio of 0.92, VIPER ENERGY INC demonstrates a conservative financial approach. This signifies the company's focus on minimizing debt burdens while preserving a solid equity position.
- VIPER ENERGY INC exhibits a favorable ownership structure, with an institutional shareholder ownership of 45.88%. This signifies a diverse investor base, which can contribute to a more stable and efficient market for the stock.
What is the technical picture of NASDAQ:VNOM telling us.
ChartMill assigns a proprietary Technical Rating to each stock. The score is computed daily by evaluating various technical indicators and properties. The score ranges from 0 to 10.
Taking everything into account, VNOM scores 8 out of 10 in our technical rating. In the last year, VNOM was one of the better performers, but we do observe some doubts in the very recent evolution.
- Looking at the yearly performance, VNOM did better than 90% of all other stocks. We also observe that the gains produced by VNOM over the past year are nicely spread over this period.
- VNOM is part of the Oil, Gas & Consumable Fuels industry. There are 208 other stocks in this industry. VNOM outperforms 96% of them.
- VNOM is currently trading in the upper part of its 52 week range. The S&P500 Index however is currently trading near a new high, so VNOM is lagging the market slightly.
- The long term trend is positive and the short term trend is negative. It is probably better to wait until this picture becomes clearer.
Check the latest full technical report of VNOM for a complete technical analysis.
A complete fundamental analysis of NASDAQ:VNOM
ChartMill assigns a Fundamental Rating to every stock. This score ranges from 0 to 10 and is updated daily. The score is determined by evaluating multiple fundamental indicators and properties.
VNOM gets a fundamental rating of 6 out of 10. The analysis compared the fundamentals against 208 industry peers in the Oil, Gas & Consumable Fuels industry. While VNOM has a great health rating, its profitability is only average at the moment. VNOM is quite expensive at the moment. It does show a decent growth rate.
For an up to date full fundamental analysis you can check the fundamental report of VNOM
More ideas for growth investing can be found on ChartMill in our CANSLIM screen.
Disclaimer
This is not investing advice! The article highlights some of the observations at the time of writing, but you should always make your own analysis and invest based on your own insights.
