
NYSE:VEEV—A High-Growth Stock Gearing Up for Its Next Upward Move.
By Mill Chart
Last update: Sep 19, 2024
In this article we will dive into VEEVA SYSTEMS INC-CLASS A (NYSE:VEEV) as a possible candidate for growth investing. Investors should always do their own research, but we noticed VEEVA SYSTEMS INC-CLASS A showing up in our strong growth, ready to breakout screen, which makes it worth to investigate a bit more.
Deciphering NYSE:VEEV's Growth Rating
To evaluate a stock's growth potential, ChartMill utilizes a Growth Rating on a scale of 0 to 10. This comprehensive assessment considers various growth aspects, including historical and estimated EPS and revenue growth. NYSE:VEEV has achieved a 8 out of 10:
- VEEV shows a strong growth in Earnings Per Share. In the last year, the EPS has been growing by 32.73%, which is quite impressive.
- Measured over the past years, VEEV shows a very strong growth in Earnings Per Share. The EPS has been growing by 24.47% on average per year.
- VEEV shows quite a strong growth in Revenue. In the last year, the Revenue has grown by 15.29%.
- The Revenue has been growing by 22.35% on average over the past years. This is a very strong growth!
- Based on estimates for the next years, VEEV will show a quite strong growth in Earnings Per Share. The EPS will grow by 15.59% on average per year.
- VEEV is expected to show quite a strong growth in Revenue. In the coming years, the Revenue will grow by 13.11% yearly.
Understanding NYSE:VEEV's Health
ChartMill assigns a proprietary Health Rating to each stock. The score is computed by evaluating various liquidity and solvency ratios and ranges from 0 to 10. NYSE:VEEV was assigned a score of 9 for health:
- An Altman-Z score of 20.44 indicates that VEEV is not in any danger for bankruptcy at the moment.
- With an excellent Altman-Z score value of 20.44, VEEV belongs to the best of the industry, outperforming 94.74% of the companies in the same industry.
- There is no outstanding debt for VEEV. This means it has a Debt/Equity and Debt/FCF ratio of 0 and it is amongst the best of the sector and industry.
- VEEV has a Current Ratio of 5.01. This indicates that VEEV is financially healthy and has no problem in meeting its short term obligations.
- VEEV has a better Current ratio (5.01) than 86.84% of its industry peers.
- VEEV has a Quick Ratio of 5.01. This indicates that VEEV is financially healthy and has no problem in meeting its short term obligations.
- VEEV's Quick ratio of 5.01 is amongst the best of the industry. VEEV outperforms 86.84% of its industry peers.
Assessing Profitability for NYSE:VEEV
ChartMill utilizes a Profitability Rating to assess stocks, scoring them on a scale of 0 to 10. This rating takes into account a variety of profitability ratios and margins, both in absolute terms and in comparison to industry peers. NYSE:VEEV has earned a 7 out of 10:
- With an excellent Return On Assets value of 9.72%, VEEV belongs to the best of the industry, outperforming 94.74% of the companies in the same industry.
- VEEV has a better Return On Equity (11.87%) than 94.74% of its industry peers.
- The Return On Invested Capital of VEEV (8.87%) is better than 97.37% of its industry peers.
- The Average Return On Invested Capital over the past 3 years for VEEV is above the industry average of 6.10%.
- VEEV has a better Profit Margin (23.91%) than 94.74% of its industry peers.
- The Operating Margin of VEEV (22.94%) is better than 97.37% of its industry peers.
- VEEV's Gross Margin of 73.35% is fine compared to the rest of the industry. VEEV outperforms 76.32% of its industry peers.
Why is NYSE:VEEV a setup?
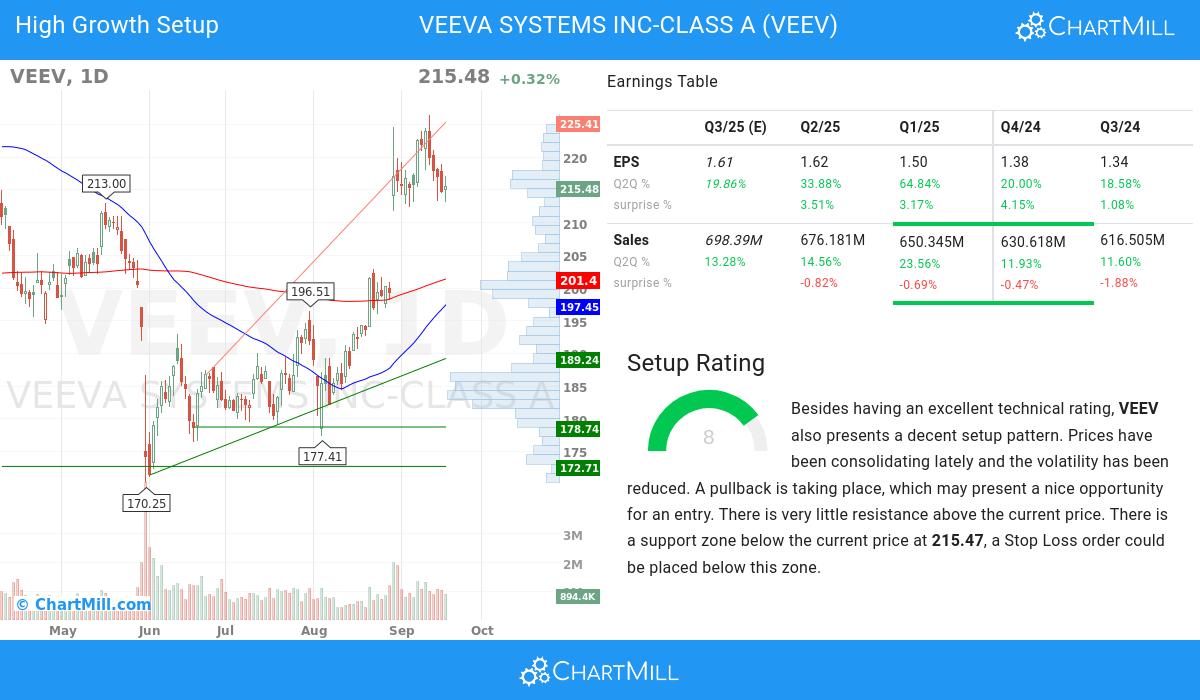
In addition to the Technical Rating, ChartMill provides a Setup Rating for each stock. This rating, ranging from 0 to 10, assesses the extent of consolidation in the stock based on multiple short-term technical indicators. Currently, NYSE:VEEV has a 8 as its setup rating:
Besides having an excellent technical rating, VEEV also presents a decent setup pattern. We see reduced volatility while prices have been consolidating in the most recent period. A pullback is taking place, which may present a nice opportunity for an entry. There is very little resistance above the current price. There is a support zone below the current price at 215.47, a Stop Loss order could be placed below this zone.
Our Strong Growth screener lists more Strong Growth stocks and is updated daily.
Our latest full fundamental report of VEEV contains the most current fundamental analsysis.
Our latest full technical report of VEEV contains the most current technical analsysis.
Disclaimer
Important Note: The content of this article is not intended as trading advice. It is essential to perform your own analysis and exercise caution when making trading decisions. The article presents observations created by automated analysis but does not guarantee any trading or investment outcomes. Always trade responsibly and make independent judgments.
