
Take a closer look at VEEVA SYSTEMS INC-CLASS A (NYSE:VEEV), an affordable growth stock uncovered by our stock screener. NYSE:VEEV boasts strong growth prospects and excels in financial health indicators, all while maintaining a reasonable valuation. Let's break it down further.
Growth Assessment of NYSE:VEEV
To evaluate a stock's growth potential, ChartMill utilizes a Growth Rating on a scale of 0 to 10. This comprehensive assessment considers various growth aspects, including historical and estimated EPS and revenue growth. NYSE:VEEV has achieved a 8 out of 10:
- The Earnings Per Share has grown by an impressive 32.73% over the past year.
- Measured over the past years, VEEV shows a very strong growth in Earnings Per Share. The EPS has been growing by 24.47% on average per year.
- Looking at the last year, VEEV shows a quite strong growth in Revenue. The Revenue has grown by 15.29% in the last year.
- Measured over the past years, VEEV shows a very strong growth in Revenue. The Revenue has been growing by 22.35% on average per year.
- Based on estimates for the next years, VEEV will show a quite strong growth in Earnings Per Share. The EPS will grow by 15.59% on average per year.
- VEEV is expected to show quite a strong growth in Revenue. In the coming years, the Revenue will grow by 13.11% yearly.
Looking at the Valuation
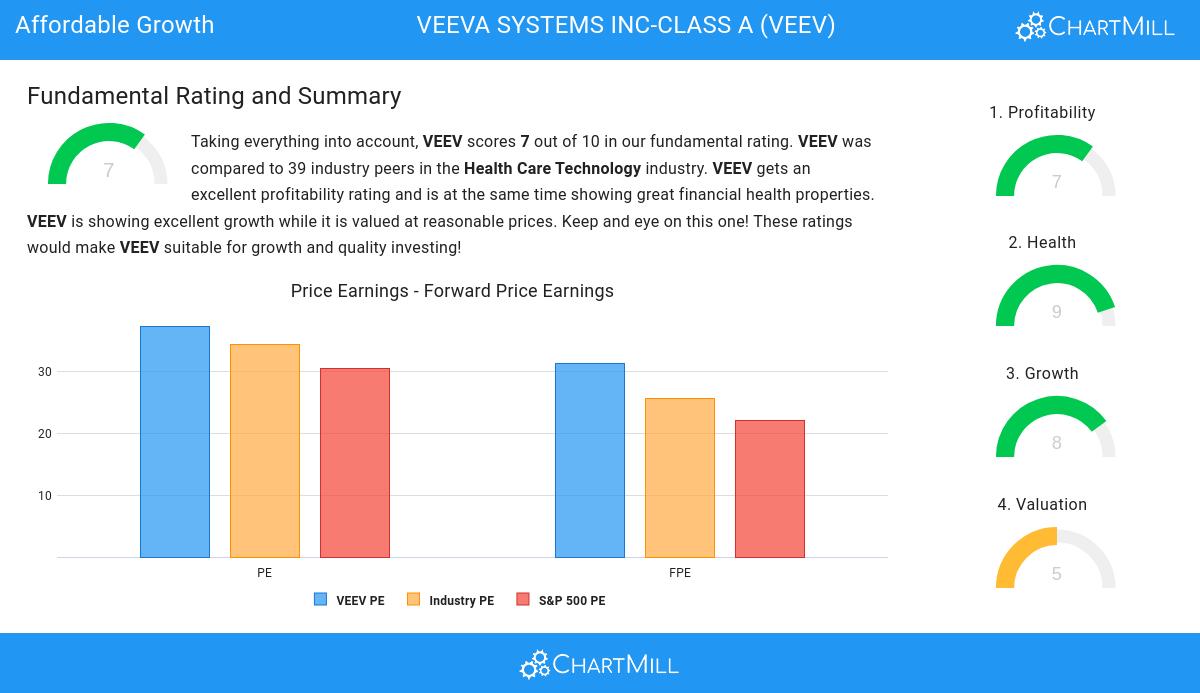
ChartMill assigns a Valuation Rating to every stock. This score ranges from 0 to 10 and evaluates the different valuation aspects and compares the price to earnings and cash flows, while taking into account profitability and growth. NYSE:VEEV scores a 5 out of 10:
- Compared to the rest of the industry, the Price/Earnings ratio of VEEV indicates a rather cheap valuation: VEEV is cheaper than 84.21% of the companies listed in the same industry.
- Compared to the rest of the industry, the Price/Forward Earnings ratio of VEEV indicates a rather cheap valuation: VEEV is cheaper than 81.58% of the companies listed in the same industry.
- Compared to the rest of the industry, the Enterprise Value to EBITDA ratio of VEEV indicates a somewhat cheap valuation: VEEV is cheaper than 68.42% of the companies listed in the same industry.
- Based on the Price/Free Cash Flow ratio, VEEV is valued a bit cheaper than 68.42% of the companies in the same industry.
- VEEV has a very decent profitability rating, which may justify a higher PE ratio.
- VEEV's earnings are expected to grow with 17.10% in the coming years. This may justify a more expensive valuation.
A Closer Look at Health for NYSE:VEEV
ChartMill assigns a proprietary Health Rating to each stock. The score is computed by evaluating various liquidity and solvency ratios and ranges from 0 to 10. NYSE:VEEV was assigned a score of 9 for health:
- VEEV has an Altman-Z score of 20.65. This indicates that VEEV is financially healthy and has little risk of bankruptcy at the moment.
- VEEV has a better Altman-Z score (20.65) than 94.74% of its industry peers.
- VEEV has no outstanding debt. Therefor its Debt/Equity and Debt/FCF ratios are 0 and belong to the best of the industry.
- A Current Ratio of 5.01 indicates that VEEV has no problem at all paying its short term obligations.
- The Current ratio of VEEV (5.01) is better than 86.84% of its industry peers.
- VEEV has a Quick Ratio of 5.01. This indicates that VEEV is financially healthy and has no problem in meeting its short term obligations.
- VEEV has a Quick ratio of 5.01. This is amongst the best in the industry. VEEV outperforms 86.84% of its industry peers.
Profitability Examination for NYSE:VEEV
ChartMill's Profitability Rating offers a unique perspective on stock analysis, providing scores from 0 to 10. These ratings consider a wide range of profitability metrics and margins, both in comparison to industry peers and on their own merits. For NYSE:VEEV, the assigned 7 is a significant indicator of profitability:
- VEEV has a better Return On Assets (9.72%) than 94.74% of its industry peers.
- VEEV has a Return On Equity of 11.87%. This is amongst the best in the industry. VEEV outperforms 94.74% of its industry peers.
- VEEV has a Return On Invested Capital of 8.87%. This is amongst the best in the industry. VEEV outperforms 97.37% of its industry peers.
- The Average Return On Invested Capital over the past 3 years for VEEV is above the industry average of 6.10%.
- With an excellent Profit Margin value of 23.91%, VEEV belongs to the best of the industry, outperforming 94.74% of the companies in the same industry.
- The Operating Margin of VEEV (22.94%) is better than 97.37% of its industry peers.
- VEEV's Gross Margin of 73.35% is fine compared to the rest of the industry. VEEV outperforms 76.32% of its industry peers.
Our Affordable Growth screener lists more Affordable Growth stocks and is updated daily.
For an up to date full fundamental analysis you can check the fundamental report of VEEV
Keep in mind
This article should in no way be interpreted as advice. The article is based on the observed metrics at the time of writing, but you should always make your own analysis and trade or invest at your own responsibility.