
TEXAS INSTRUMENTS INC (NASDAQ:TXN) was identified as a stock worth exploring by dividend investors by our stock screener. NASDAQ:TXN scores well on profitability, solvency and liquidity. At the same time it seems to pay a decent dividend. We'll explore this a bit deeper below.
ChartMill's Evaluation of Dividend
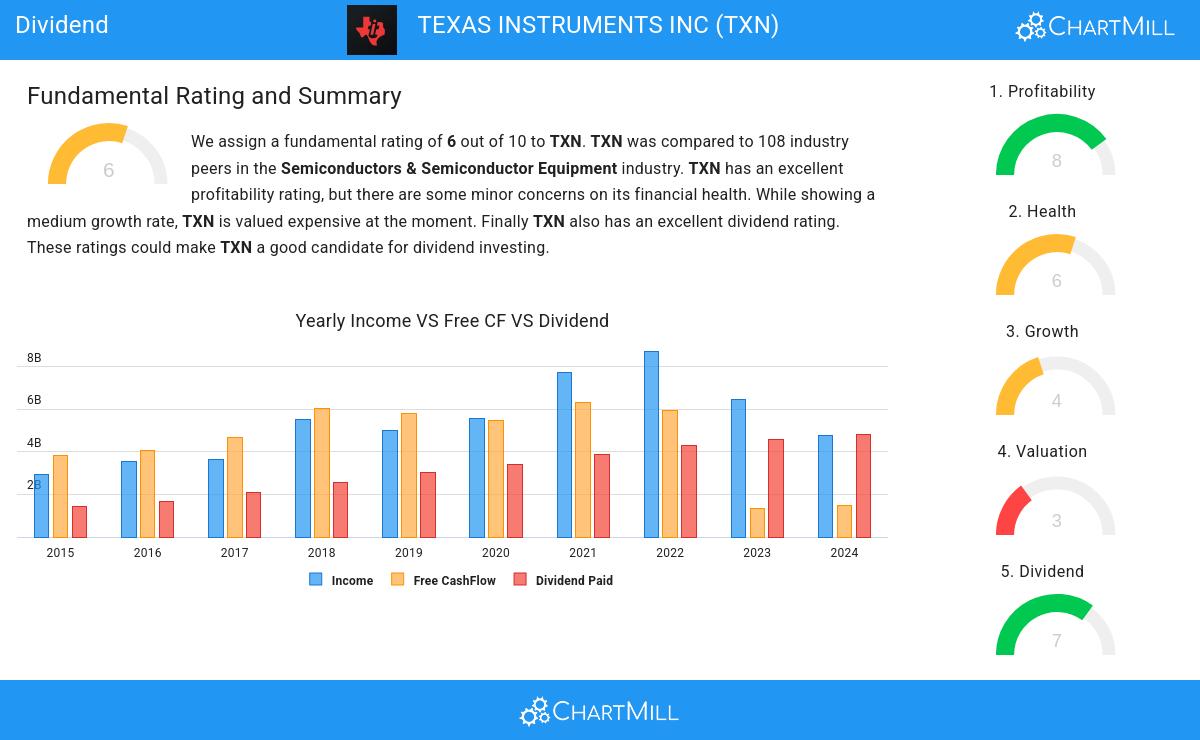
ChartMill employs its own Dividend Rating system for all stocks. This score, on a scale of 0 to 10, is determined by evaluating different dividend factors, such as yield, historical performance, dividend growth, and sustainability. NASDAQ:TXN has been assigned a 7 for dividend:
- Compared to an average industry Dividend Yield of 2.34, TXN pays a better dividend. On top of this TXN pays more dividend than 92.59% of the companies listed in the same industry.
- Compared to an average S&P500 Dividend Yield of 2.30, TXN pays a bit more dividend than the S&P500 average.
- The dividend of TXN is nicely growing with an annual growth rate of 10.46%!
- TXN has been paying a dividend for at least 10 years, so it has a reliable track record.
- TXN has not decreased their dividend for at least 10 years, which is a reliable track record.
- TXN's earnings are growing more than its dividend. This makes the dividend growth sustainable.
Evaluating Health: NASDAQ:TXN
To gauge a stock's financial health, ChartMill utilizes a Health Rating on a scale of 0 to 10. This comprehensive evaluation encompasses liquidity and solvency, both in absolute terms and in comparison to industry peers. NASDAQ:TXN has earned a 6 out of 10:
- An Altman-Z score of 8.76 indicates that TXN is not in any danger for bankruptcy at the moment.
- With a decent Altman-Z score value of 8.76, TXN is doing good in the industry, outperforming 76.85% of the companies in the same industry.
- A Current Ratio of 4.12 indicates that TXN has no problem at all paying its short term obligations.
- Looking at the Current ratio, with a value of 4.12, TXN is in the better half of the industry, outperforming 70.37% of the companies in the same industry.
- A Quick Ratio of 2.88 indicates that TXN has no problem at all paying its short term obligations.
- TXN has a Quick ratio of 2.88. This is in the better half of the industry: TXN outperforms 62.04% of its industry peers.
How do we evaluate the Profitability for NASDAQ:TXN?
ChartMill assigns a proprietary Profitability Rating to each stock. The score is computed by evaluating various profitability ratios and margins and ranges from 0 to 10. NASDAQ:TXN was assigned a score of 8 for profitability:
- The Return On Assets of TXN (13.44%) is better than 83.33% of its industry peers.
- With an excellent Return On Equity value of 28.24%, TXN belongs to the best of the industry, outperforming 90.74% of the companies in the same industry.
- With an excellent Return On Invested Capital value of 14.73%, TXN belongs to the best of the industry, outperforming 86.11% of the companies in the same industry.
- TXN had an Average Return On Invested Capital over the past 3 years of 24.88%. This is significantly above the industry average of 11.64%.
- The last Return On Invested Capital (14.73%) for TXN is well below the 3 year average (24.88%), which needs to be investigated, but indicates that TXN had better years and this may not be a problem.
- The Profit Margin of TXN (30.52%) is better than 92.59% of its industry peers.
- The Operating Margin of TXN (34.15%) is better than 94.44% of its industry peers.
- Looking at the Gross Margin, with a value of 58.14%, TXN belongs to the top of the industry, outperforming 82.41% of the companies in the same industry.
Every day, new Best Dividend stocks can be found on ChartMill in our Best Dividend screener.
Our latest full fundamental report of TXN contains the most current fundamental analsysis.
Disclaimer
This article should in no way be interpreted as advice. The article is based on the observed metrics at the time of writing, but you should always make your own analysis and trade or invest at your own responsibility.