Exploring the Growth Potential of TRADEWEB MARKETS INC-CLASS A (NASDAQ:TW) as It Nears a Breakout.
By Mill Chart
Last update: Mar 17, 2025
Groth investors are looking for stocks showing high revenue and EPS growth. We will have a look here to see if TRADEWEB MARKETS INC-CLASS A (NASDAQ:TW) is suited for growth investing, while it is forming a base and may be ready to breakout. Investors should of course do their own research, but we spotted TRADEWEB MARKETS INC-CLASS A showing up in our growth with base formation screen, so it may be worth spending some more time on it.
Understanding TW's Growth
ChartMill assigns a Growth Rating to each stock, ranging from 0 to 10. This rating is determined by analyzing different growth elements, including EPS and revenue growth, spanning both historical and future figures. In the case of TW, the assigned 8 reflects its growth potential:
- The Earnings Per Share has grown by an impressive 29.78% over the past year.
- The Earnings Per Share has been growing by 23.66% on average over the past years. This is a very strong growth
- The Revenue has grown by 28.98% in the past year. This is a very strong growth!
- The Revenue has been growing by 17.35% on average over the past years. This is quite good.
- The Earnings Per Share is expected to grow by 15.59% on average over the next years. This is quite good.
- Based on estimates for the next years, TW will show a quite strong growth in Revenue. The Revenue will grow by 10.52% on average per year.
Deciphering TW's Health Rating
ChartMill assigns a Health Rating to every stock. This score ranges from 0 to 10 and evaluates the different health aspects like liquidity and solvency, both absolutely, but also relative to the industry peers. TW scores a 8 out of 10:
- An Altman-Z score of 12.78 indicates that TW is not in any danger for bankruptcy at the moment.
- TW has a better Altman-Z score (12.78) than 96.41% of its industry peers.
- TW has no outstanding debt. Therefor its Debt/Equity and Debt/FCF ratios are 0 and belong to the best of the industry.
- TW has a Current Ratio of 3.99. This indicates that TW is financially healthy and has no problem in meeting its short term obligations.
- TW has a Current ratio of 3.99. This is amongst the best in the industry. TW outperforms 84.30% of its industry peers.
- TW has a Quick Ratio of 3.99. This indicates that TW is financially healthy and has no problem in meeting its short term obligations.
- With an excellent Quick ratio value of 3.99, TW belongs to the best of the industry, outperforming 84.30% of the companies in the same industry.
Profitability Analysis for TW
ChartMill assigns a Profitability Rating to every stock. This score ranges from 0 to 10 and evaluates the different profitability ratios and margins, both absolutely, but also relative to the industry peers. TW scores a 7 out of 10:
- TW has a better Return On Assets (6.89%) than 82.06% of its industry peers.
- The Return On Invested Capital of TW (7.58%) is better than 79.82% of its industry peers.
- The last Return On Invested Capital (7.58%) for TW is above the 3 year average (6.25%), which is a sign of increasing profitability.
- TW has a better Profit Margin (29.03%) than 68.61% of its industry peers.
- TW's Profit Margin has improved in the last couple of years.
- Looking at the Operating Margin, with a value of 39.55%, TW is in the better half of the industry, outperforming 68.61% of the companies in the same industry.
- TW's Operating Margin has improved in the last couple of years.
Looking at the Setup
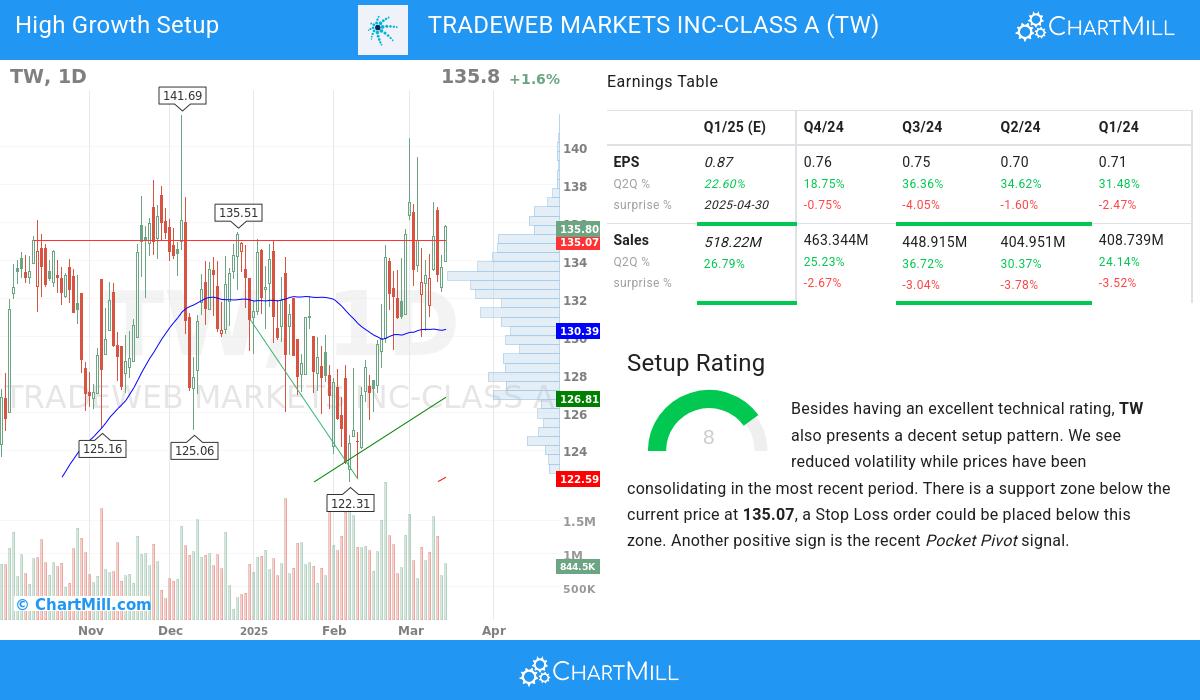
ChartMill also assign a Setup Rating to every stock. This setup score also ranges from 0 to 10 and determines to which extend the stock is consolidating. This is achieved by evaluating multiple short term technical indicators. TW currently has a 8 as setup rating:
TW has an excellent technical rating and also presents a decent setup pattern. Prices have been consolidating lately and the volatility has been reduced. There is a support zone below the current price at 135.07, a Stop Loss order could be placed below this zone. Very recently a Pocket Pivot signal was observed. This is another positive sign.
Our Strong Growth screener lists more Strong Growth stocks and is updated daily.
Our latest full fundamental report of TW contains the most current fundamental analsysis.
Check the latest full technical report of TW for a complete technical analysis.
Keep in mind
Important Note: The content of this article is not intended as trading advice. It is essential to perform your own analysis and exercise caution when making trading decisions. The article presents observations created by automated analysis but does not guarantee any trading or investment outcomes. Always trade responsibly and make independent judgments.
135.29
+0.26 (+0.19%)
Find more stocks in the Stock Screener
TW Latest News and Analysis
 2 days ago - ChartmillIs TRADEWEB MARKETS INC-CLASS A (NASDAQ:TW) on the Verge of a Major Breakout as a Strong Growth Stock?
Based on fundamental and technical analysis of NASDAQ:TW we conclude: TRADEWEB MARKETS INC-CLASS A (NASDAQ:TW): a strong growth stock preparing for the next leg up?.
