
Why NYSE:TTE is a Top Pick for Dividend Investors.
By Mill Chart
Last update: Oct 9, 2024
Consider TOTALENERGIES SE -SPON ADR (NYSE:TTE) as a top pick for dividend investors, identified by our stock screening tool. NYSE:TTE shines in terms of profitability, solvency, and liquidity, all while paying a decent dividend. Let's dive deeper into the analysis.
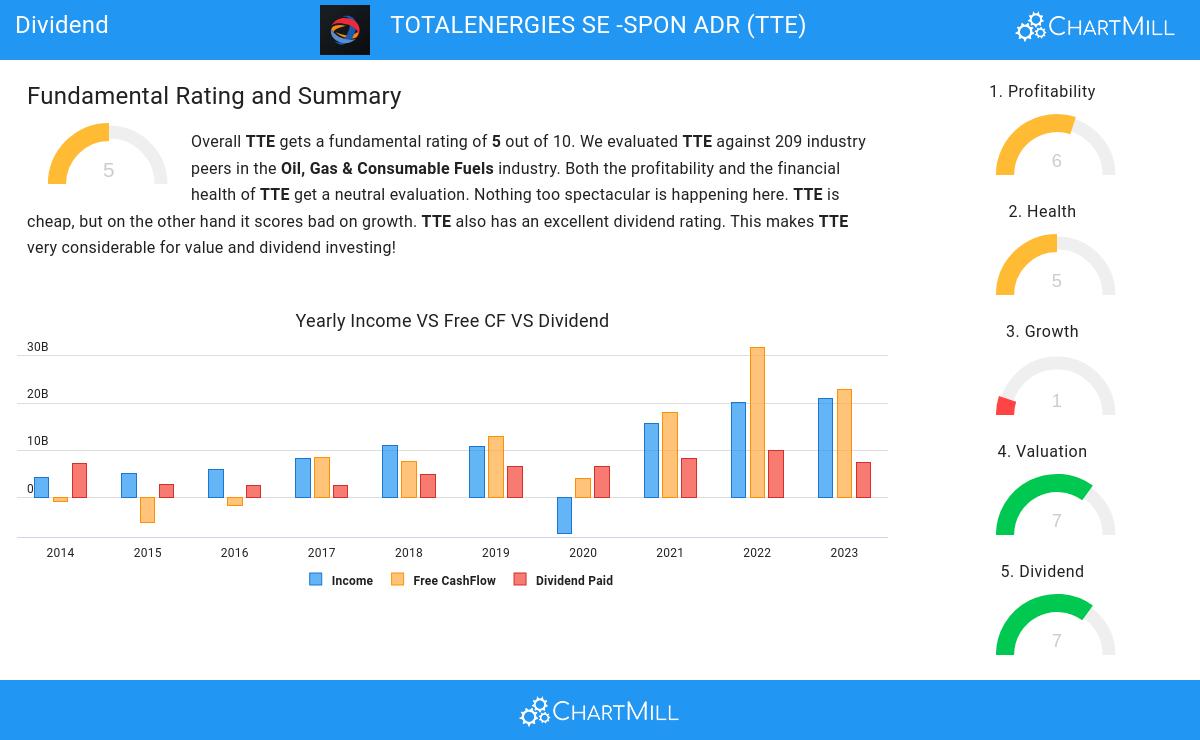
Understanding NYSE:TTE's Dividend Score
ChartMill assigns a Dividend Rating to each stock, ranging from 0 to 10. This rating is calculated by analyzing various dividend elements, such as yield, historical performance, dividend growth, and sustainability. NYSE:TTE has been awarded a 7 for its dividend quality:
- TTE has a Yearly Dividend Yield of 5.06%, which is a nice return.
- Compared to an average industry Dividend Yield of 6.32, TTE pays a bit more dividend than its industry peers.
- Compared to an average S&P500 Dividend Yield of 2.22, TTE pays a better dividend.
- The dividend of TTE is nicely growing with an annual growth rate of 10.18%!
- TTE has been paying a dividend for at least 10 years, so it has a reliable track record.
- 36.18% of the earnings are spent on dividend by TTE. This is a low number and sustainable payout ratio.
How do we evaluate the Health for NYSE:TTE?
ChartMill assigns a Health Rating to every stock. This score ranges from 0 to 10 and evaluates the different health aspects like liquidity and solvency, both absolutely, but also relative to the industry peers. NYSE:TTE scores a 5 out of 10:
- The Debt to FCF ratio of TTE is 2.58, which is a good value as it means it would take TTE, 2.58 years of fcf income to pay off all of its debts.
- TTE's Debt to FCF ratio of 2.58 is fine compared to the rest of the industry. TTE outperforms 73.21% of its industry peers.
- A Debt/Equity ratio of 0.36 indicates that TTE is not too dependend on debt financing.
Exploring NYSE:TTE's Profitability
ChartMill employs its own Profitability Rating system for stock evaluation. This score, ranging from 0 to 10, is derived from an analysis of diverse profitability metrics and margins. In the case of NYSE:TTE, the assigned 6 is noteworthy for profitability:
- TTE has a better Return On Assets (7.50%) than 65.07% of its industry peers.
- TTE has a better Return On Equity (17.86%) than 65.07% of its industry peers.
- Looking at the Return On Invested Capital, with a value of 13.22%, TTE is in the better half of the industry, outperforming 74.16% of the companies in the same industry.
- TTE's Profit Margin has improved in the last couple of years.
- In the last couple of years the Operating Margin of TTE has grown nicely.
- In the last couple of years the Gross Margin of TTE has grown nicely.
Every day, new Best Dividend stocks can be found on ChartMill in our Best Dividend screener.
Our latest full fundamental report of TTE contains the most current fundamental analsysis.
Keep in mind
This article should in no way be interpreted as advice. The article is based on the observed metrics at the time of writing, but you should always make your own analysis and trade or invest at your own responsibility.
