
NASDAQ:TTD—Positioned as a High-Growth Stock, Ready for a Potential Breakout.
By Mill Chart
Last update: Sep 6, 2024
Exploring Growth Potential: TRADE DESK INC/THE -CLASS A (NASDAQ:TTD) and Its Base Formation. Growth investors seek promising revenue and EPS growth, and TRADE DESK INC/THE -CLASS A has come under our scrutiny for potential growth investing. While it's crucial to do your own research, we've detected TRADE DESK INC/THE -CLASS A on our screen for growth with base formation, suggesting it merits a closer look.
Evaluating Growth: NASDAQ:TTD
To evaluate a stock's growth potential, ChartMill utilizes a Growth Rating on a scale of 0 to 10. This comprehensive assessment considers various growth aspects, including historical and estimated EPS and revenue growth. NASDAQ:TTD has achieved a 9 out of 10:
- The Earnings Per Share has grown by an impressive 20.87% over the past year.
- TTD shows a strong growth in Earnings Per Share. Measured over the last years, the EPS has been growing by 36.07% yearly.
- Looking at the last year, TTD shows a very strong growth in Revenue. The Revenue has grown by 25.53%.
- The Revenue has been growing by 32.46% on average over the past years. This is a very strong growth!
- The Earnings Per Share is expected to grow by 27.32% on average over the next years. This is a very strong growth
- TTD is expected to show a strong growth in Revenue. In the coming years, the Revenue will grow by 21.42% yearly.
Health Analysis for NASDAQ:TTD
ChartMill assigns a proprietary Health Rating to each stock. The score is computed by evaluating various liquidity and solvency ratios and ranges from 0 to 10. NASDAQ:TTD was assigned a score of 8 for health:
- An Altman-Z score of 12.17 indicates that TTD is not in any danger for bankruptcy at the moment.
- TTD's Altman-Z score of 12.17 is amongst the best of the industry. TTD outperforms 97.83% of its industry peers.
- There is no outstanding debt for TTD. This means it has a Debt/Equity and Debt/FCF ratio of 0 and it is amongst the best of the sector and industry.
- Looking at the Current ratio, with a value of 1.80, TTD is in the better half of the industry, outperforming 68.48% of the companies in the same industry.
- TTD's Quick ratio of 1.80 is fine compared to the rest of the industry. TTD outperforms 68.48% of its industry peers.
Profitability Insights: NASDAQ:TTD
ChartMill utilizes a Profitability Rating to assess stocks, scoring them on a scale of 0 to 10. This rating takes into account a variety of profitability ratios and margins, both in absolute terms and in comparison to industry peers. NASDAQ:TTD has earned a 7 out of 10:
- With a decent Return On Assets value of 4.91%, TTD is doing good in the industry, outperforming 79.35% of the companies in the same industry.
- TTD's Return On Equity of 10.54% is fine compared to the rest of the industry. TTD outperforms 79.35% of its industry peers.
- TTD has a Return On Invested Capital of 9.14%. This is amongst the best in the industry. TTD outperforms 80.43% of its industry peers.
- The last Return On Invested Capital (9.14%) for TTD is above the 3 year average (5.35%), which is a sign of increasing profitability.
- Looking at the Profit Margin, with a value of 11.65%, TTD belongs to the top of the industry, outperforming 86.96% of the companies in the same industry.
- With a decent Operating Margin value of 14.05%, TTD is doing good in the industry, outperforming 78.26% of the companies in the same industry.
- With an excellent Gross Margin value of 81.23%, TTD belongs to the best of the industry, outperforming 94.57% of the companies in the same industry.
How do we evaluate the setup for NASDAQ:TTD?
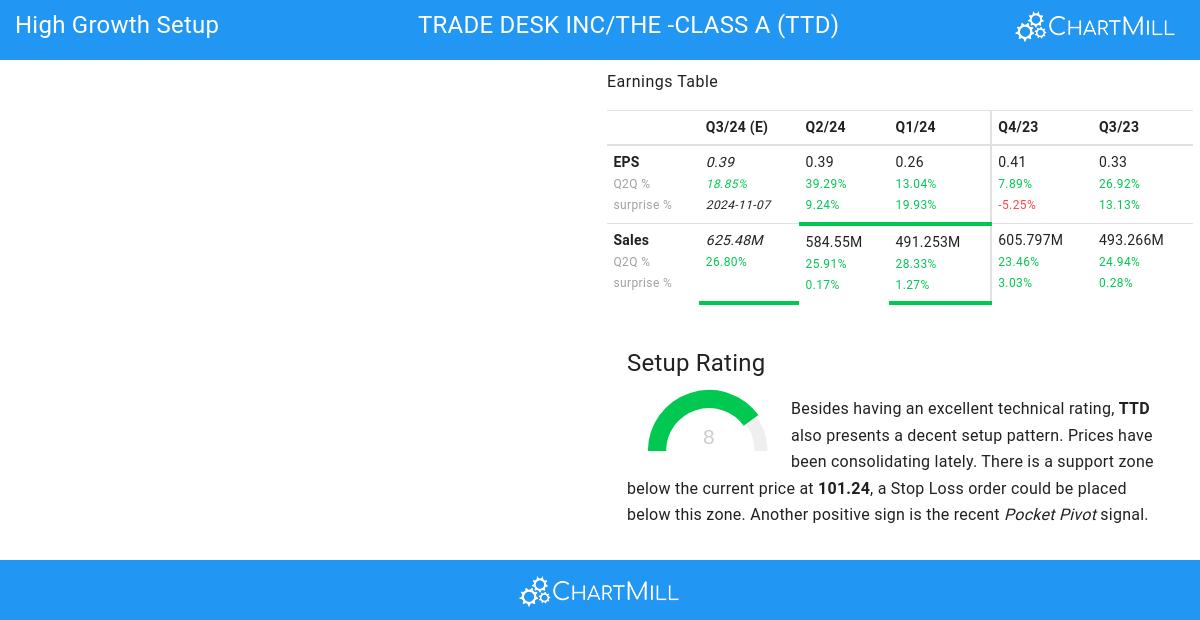
ChartMill also assign a Setup Rating to every stock. With this score it is determined to what extend the stock has been trading in a range in the recent days and weeks. This score also ranges from 0 to 10 and is updated daily. The setup score evaluates various short term technical indicators. NASDAQ:TTD scores a 8 out of 10:
Besides having an excellent technical rating, TTD also presents a decent setup pattern. Prices have been consolidating lately. There is a support zone below the current price at 101.24, a Stop Loss order could be placed below this zone. Very recently a Pocket Pivot signal was observed. This is another positive sign.
More Strong Growth stocks can be found in our Strong Growth screener.
For an up to date full fundamental analysis you can check the fundamental report of TTD
For an up to date full technical analysis you can check the technical report of TTD
Disclaimer
This is not investing advice! The article highlights some of the observations at the time of writing, but you should always make your own analysis and invest based on your own insights.
