Uncovering Dividend Opportunities with NYSE:TS.
By Mill Chart
Last update: Sep 17, 2024
Unearth the potential of TENARIS SA-ADR (NYSE:TS) as a dividend stock recommended by our stock screening tool. NYSE:TS maintains a robust financial footing and delivers a sustainable dividend. We'll delve into the details below.
Dividend Insights: NYSE:TS
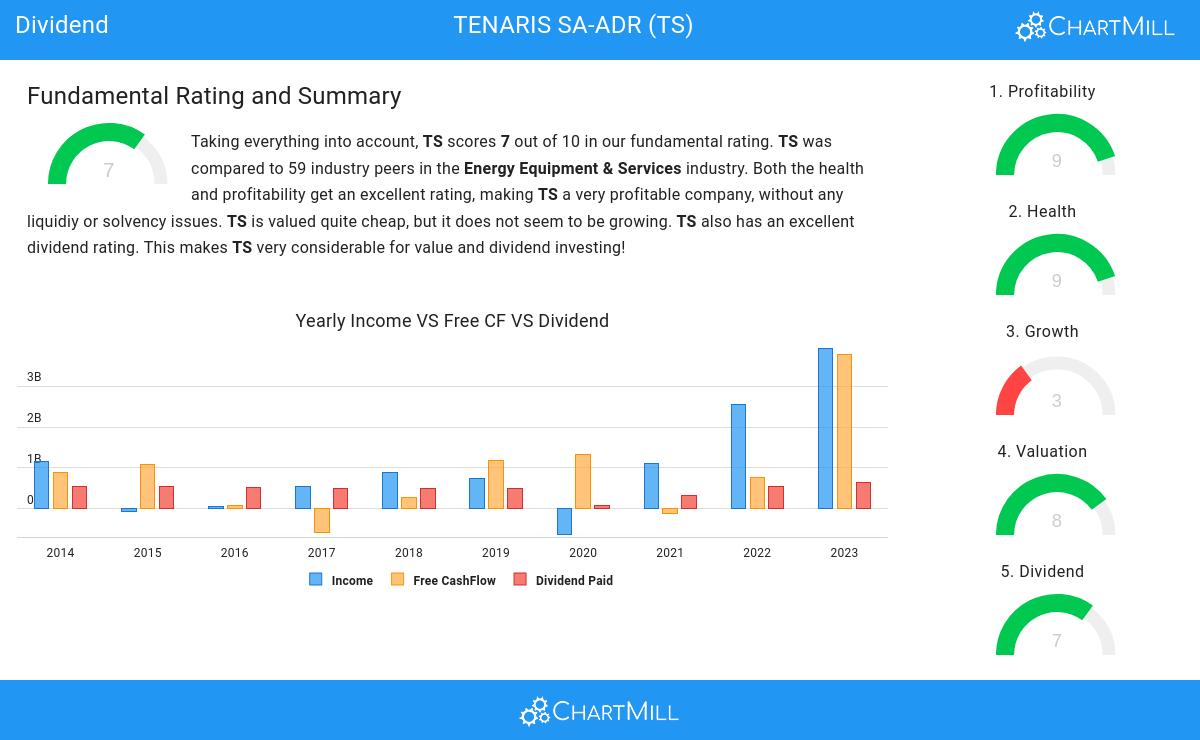
To gauge a stock's dividend quality, ChartMill utilizes a Dividend Rating ranging from 0 to 10. This comprehensive assessment considers various dividend aspects, including yield, history, growth, and sustainability. NYSE:TS has achieved a 7 out of 10:
- TS has a Yearly Dividend Yield of 4.20%, which is a nice return.
- TS's Dividend Yield is rather good when compared to the industry average which is at 3.62. TS pays more dividend than 88.14% of the companies in the same industry.
- Compared to an average S&P500 Dividend Yield of 2.26, TS pays a better dividend.
- TS has been paying a dividend for at least 10 years, so it has a reliable track record.
- TS pays out 25.33% of its income as dividend. This is a sustainable payout ratio.
Deciphering NYSE:TS's Health Rating
ChartMill employs its own Health Rating for stock assessment. This rating, ranging from 0 to 10, is calculated by examining various liquidity and solvency ratios. In the case of NYSE:TS, the assigned 9 reflects its health status:
- An Altman-Z score of 4.80 indicates that TS is not in any danger for bankruptcy at the moment.
- With an excellent Altman-Z score value of 4.80, TS belongs to the best of the industry, outperforming 93.22% of the companies in the same industry.
- The Debt to FCF ratio of TS is 0.23, which is an excellent value as it means it would take TS, only 0.23 years of fcf income to pay off all of its debts.
- TS has a better Debt to FCF ratio (0.23) than 94.92% of its industry peers.
- TS has a Debt/Equity ratio of 0.01. This is a healthy value indicating a solid balance between debt and equity.
- TS has a better Debt to Equity ratio (0.01) than 91.53% of its industry peers.
- TS has a Current Ratio of 3.11. This indicates that TS is financially healthy and has no problem in meeting its short term obligations.
- TS's Current ratio of 3.11 is amongst the best of the industry. TS outperforms 83.05% of its industry peers.
- TS has a better Quick ratio (1.89) than 81.36% of its industry peers.
Profitability Insights: NYSE:TS
ChartMill utilizes a Profitability Rating to assess stocks, scoring them on a scale of 0 to 10. This rating takes into account a variety of profitability ratios and margins, both in absolute terms and in comparison to industry peers. NYSE:TS has earned a 9 out of 10:
- With an excellent Return On Assets value of 12.98%, TS belongs to the best of the industry, outperforming 93.22% of the companies in the same industry.
- TS has a better Return On Equity (16.39%) than 79.66% of its industry peers.
- The Return On Invested Capital of TS (14.54%) is better than 89.83% of its industry peers.
- Measured over the past 3 years, the Average Return On Invested Capital for TS is significantly above the industry average of 8.12%.
- The last Return On Invested Capital (14.54%) for TS is above the 3 year average (13.95%), which is a sign of increasing profitability.
- TS's Profit Margin of 20.41% is amongst the best of the industry. TS outperforms 93.22% of its industry peers.
- TS's Profit Margin has improved in the last couple of years.
- TS's Operating Margin of 23.44% is amongst the best of the industry. TS outperforms 88.14% of its industry peers.
- TS's Operating Margin has improved in the last couple of years.
- With a decent Gross Margin value of 37.60%, TS is doing good in the industry, outperforming 72.88% of the companies in the same industry.
- TS's Gross Margin has improved in the last couple of years.
Every day, new Best Dividend stocks can be found on ChartMill in our Best Dividend screener.
Check the latest full fundamental report of TS for a complete fundamental analysis.
Keep in mind
This is not investing advice! The article highlights some of the observations at the time of writing, but you should always make your own analysis and invest based on your own insights.
32.6
-0.66 (-1.98%)
Find more stocks in the Stock Screener
TS Latest News and Analysis
 10 days ago - ChartmillExploring TENARIS SA-ADR (NYSE:TS)'s dividend characteristics.
Why TENARIS SA-ADR (NYSE:TS) provides a good dividend, while having solid fundamentals.
