
Will TERRENO REALTY CORP (NYSE:TRNO) breakout?
By Mill Chart
Last update: Mar 6, 2025
TERRENO REALTY CORP (NYSE:TRNO) has been identified as a Technical Breakout Setup Pattern by our stock screener. This pattern typically occurs when a stock takes a pause after a significant rise, indicating the possibility of a continuation in the trend. While it's impossible to predict with certainty, it might be beneficial to monitor NYSE:TRNO.
Technical analysis of NYSE:TRNO
ChartMill assigns a proprietary Technical Rating to each stock. The score is computed daily by evaluating various technical indicators and properties. The score ranges from 0 to 10.
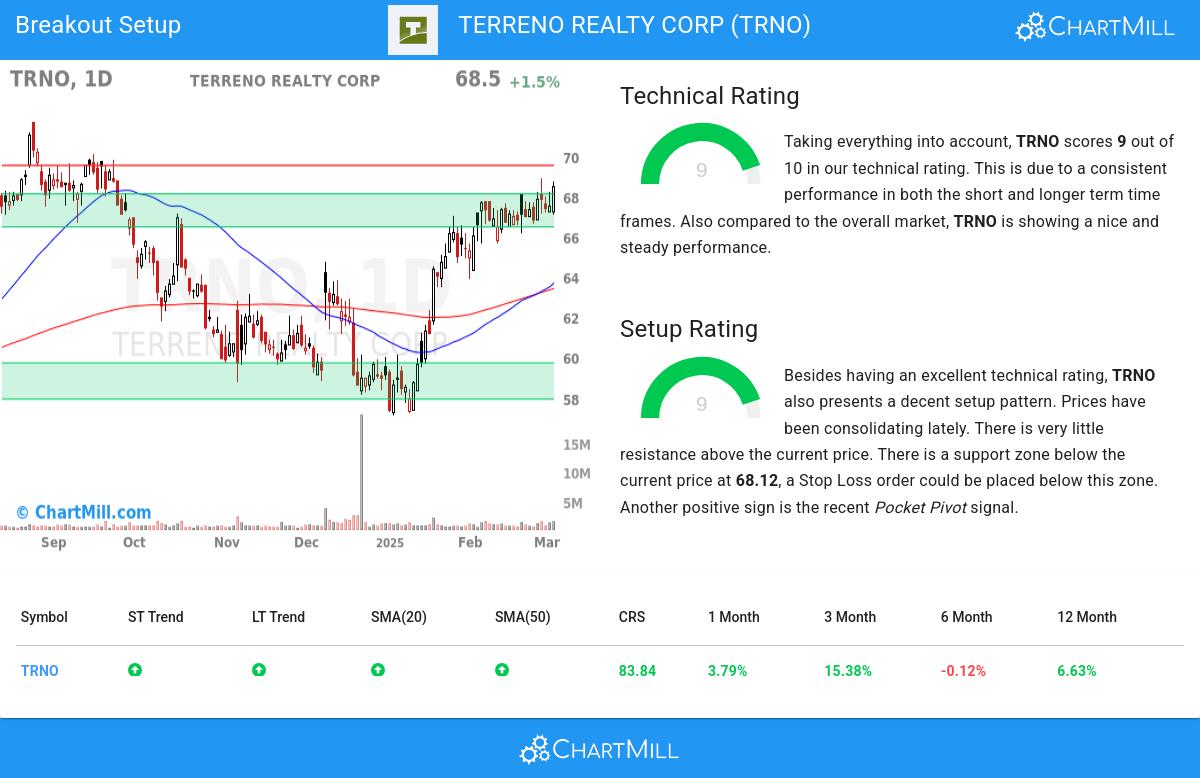
Taking everything into account, TRNO scores 9 out of 10 in our technical rating. This is due to a consistent performance in both the short and longer term time frames. Also compared to the overall market, TRNO is showing a nice and steady performance.
- Both the short term and long term trends are positive. This is a very positive sign.
- TRNO is part of the Diversified REITs industry. There are 129 other stocks in this industry. TRNO outperforms 83% of them.
- TRNO is currently trading in the upper part of its 52 week range. The S&P500 Index is also trading in the upper part of its 52 week range, so TRNO is performing more or less in line with the market.
- Looking at the yearly performance, TRNO did better than 83% of all other stocks. However, this overall good ranking is mostly due to the recent strong move.
- In the last month TRNO has a been trading in a tight range between 65.64 and 68.89.
Check the latest full technical report of TRNO for a complete technical analysis.
Why is NYSE:TRNO a setup?
In addition to the Technical Rating, ChartMill provides a Setup Rating for each stock. This rating, ranging from 0 to 10, assesses the level of consolidation in the stock based on multiple short-term technical indicators. Currently, NYSE:TRNO has a 9 as its setup rating, indicating its current consolidation status.
Besides having an excellent technical rating, TRNO also presents a decent setup pattern. Prices have been consolidating lately. There is very little resistance above the current price. There is a support zone below the current price at 68.12, a Stop Loss order could be placed below this zone. Very recently a Pocket Pivot signal was observed. This is another positive sign.
How to trade NYSE:TRNO?
One strategy to consider is waiting for the actual breakout to occur, where the stock breaks out above the current consolidation zone. Traders can then enter a buy position, anticipating further upward momentum. As a risk management measure, it is advisable to set a stop loss order below the consolidation zone.
Important Note: The content of this article is not intended as trading advice. It is essential to perform your own analysis and exercise caution when making trading decisions. The article presents technical observations generated by automated analysis but does not guarantee any trading outcomes. Always trade responsibly and make independent judgments.
More breakout setups can be found in our Breakout screener.
Keep in mind
This is not investing advice! The article highlights some of the observations at the time of writing, but you should always make your own analysis and invest based on your own insights.
