
TRAVEL + LEISURE CO (NYSE:TNL) was identified as a decent value stock by our stock screener. NYSE:TNL scores well on profitability, solvency and liquidity. At the same time it seems to be priced very reasonably. We'll explore this a bit deeper below.
Valuation Examination for NYSE:TNL
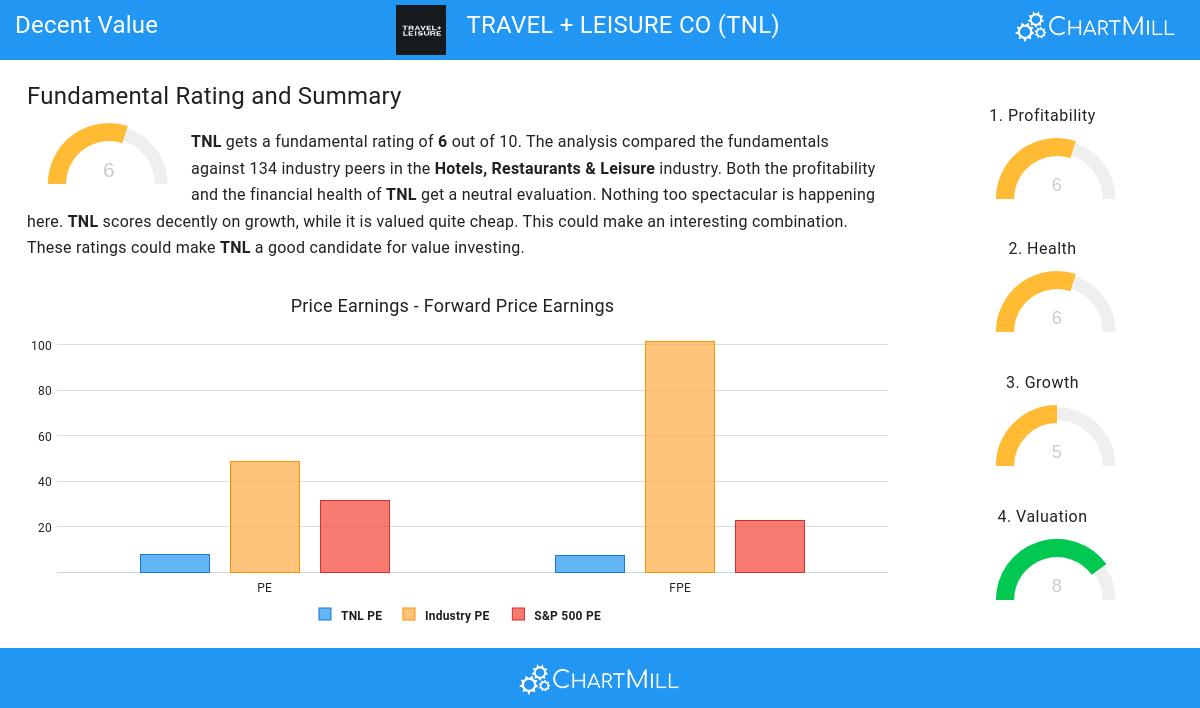
ChartMill assigns a Valuation Rating to each stock, ranging from 0 to 10. This rating is calculated by analyzing different valuation elements, such as price to earnings and free cash flow, both in absolute terms and relative to the market and industry. In the case of NYSE:TNL, the assigned 8 reflects its valuation:
- With a Price/Earnings ratio of 7.57, the valuation of TNL can be described as very cheap.
- TNL's Price/Earnings ratio is rather cheap when compared to the industry. TNL is cheaper than 96.24% of the companies in the same industry.
- When comparing the Price/Earnings ratio of TNL to the average of the S&P500 Index (31.46), we can say TNL is valued rather cheaply.
- The Price/Forward Earnings ratio is 7.09, which indicates a rather cheap valuation of TNL.
- Based on the Price/Forward Earnings ratio, TNL is valued cheaper than 96.99% of the companies in the same industry.
- TNL's Price/Forward Earnings ratio indicates a rather cheap valuation when compared to the S&P500 average which is at 22.63.
- Based on the Enterprise Value to EBITDA ratio, TNL is valued a bit cheaper than 64.66% of the companies in the same industry.
- 92.48% of the companies in the same industry are more expensive than TNL, based on the Price/Free Cash Flow ratio.
- The decent profitability rating of TNL may justify a higher PE ratio.
Profitability Examination for NYSE:TNL
ChartMill assigns a proprietary Profitability Rating to each stock. The score is computed by evaluating various profitability ratios and margins and ranges from 0 to 10. NYSE:TNL was assigned a score of 6 for profitability:
- TNL has a better Return On Assets (6.48%) than 76.69% of its industry peers.
- TNL's Return On Invested Capital of 10.57% is fine compared to the rest of the industry. TNL outperforms 72.93% of its industry peers.
- The last Return On Invested Capital (10.57%) for TNL is above the 3 year average (9.59%), which is a sign of increasing profitability.
- TNL has a better Profit Margin (11.35%) than 76.69% of its industry peers.
- Looking at the Operating Margin, with a value of 19.72%, TNL is in the better half of the industry, outperforming 78.20% of the companies in the same industry.
Looking at the Health
Every stock is evaluated by ChartMill, receiving a Health Rating on a scale of 0 to 10. This assessment considers different health aspects, including liquidity and solvency, both in absolute terms and relative to industry peers. NYSE:TNL has achieved a 6 out of 10:
- TNL has a Altman-Z score of 2.25. This is in the better half of the industry: TNL outperforms 63.91% of its industry peers.
- A Current Ratio of 3.75 indicates that TNL has no problem at all paying its short term obligations.
- TNL's Current ratio of 3.75 is amongst the best of the industry. TNL outperforms 97.74% of its industry peers.
- TNL has a Quick Ratio of 2.75. This indicates that TNL is financially healthy and has no problem in meeting its short term obligations.
- With an excellent Quick ratio value of 2.75, TNL belongs to the best of the industry, outperforming 94.74% of the companies in the same industry.
Growth Examination for NYSE:TNL
ChartMill employs its own Growth Rating system for all stocks. This score, ranging from 0 to 10, is derived by evaluating different growth factors, such as EPS and revenue growth, taking into account both past performance and future projections. NYSE:TNL has earned a 5 for growth:
- The Earnings Per Share has grown by an impressive 25.21% over the past year.
- TNL is expected to show quite a strong growth in Earnings Per Share. In the coming years, the EPS will grow by 9.22% yearly.
- The EPS growth rate is accelerating: in the next years the growth will be better than in the last years.
- When comparing the Revenue growth rate of the last years to the growth rate of the upcoming years, we see that the growth is accelerating.
Every day, new Decent Value stocks can be found on ChartMill in our Decent Value screener.
Check the latest full fundamental report of TNL for a complete fundamental analysis.
Keep in mind
This article should in no way be interpreted as advice. The article is based on the observed metrics at the time of writing, but you should always make your own analysis and trade or invest at your own responsibility.

