
For those who appreciate growth without the sticker shock, NASDAQ:TGTX is worth considering.
By Mill Chart
Last update: Oct 9, 2024
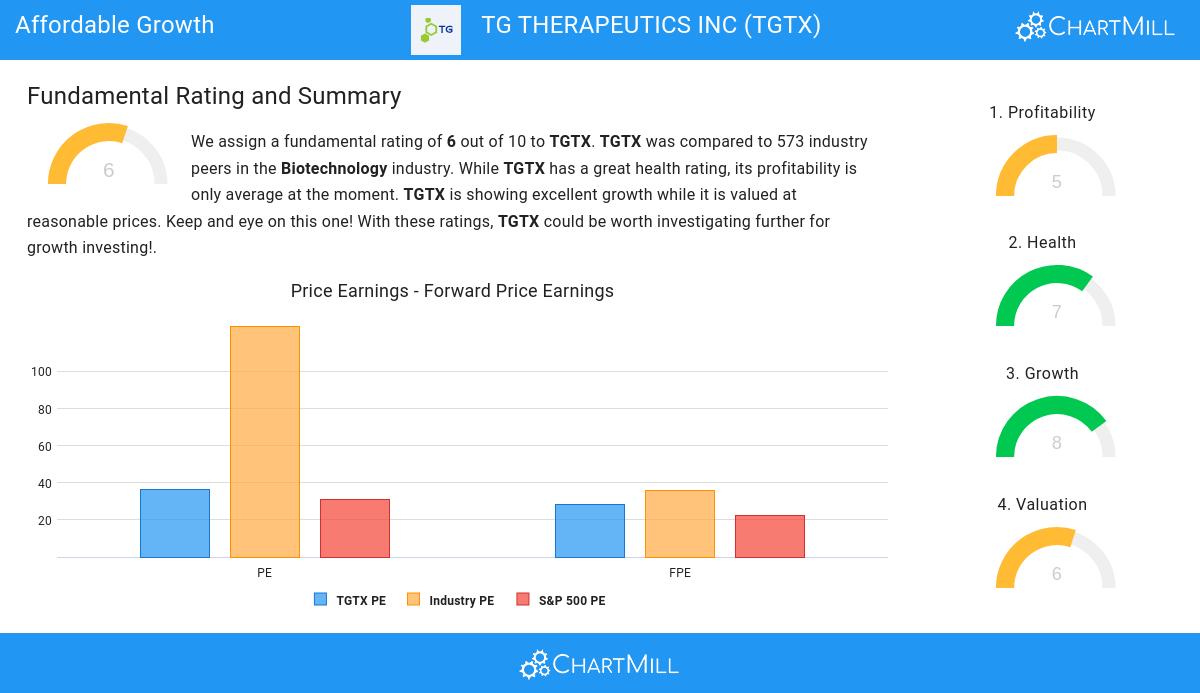
Here's TG THERAPEUTICS INC (NASDAQ:TGTX) for you, a growth stock our stock screener believes is undervalued. NASDAQ:TGTX is scoring impressively in terms of growth while demonstrating strong financials. On top of that, it remains attractively priced. Let's break it down further.
How We Gauge Growth for NASDAQ:TGTX
ChartMill assigns a proprietary Growth Rating to each stock. The score is computed by evaluating various growth aspects, like EPS and revenue growth. We take into account the history as well as the estimated future numbers. NASDAQ:TGTX was assigned a score of 8 for growth:
- TGTX shows a strong growth in Earnings Per Share. In the last year, the EPS has been growing by 147.24%, which is quite impressive.
- Looking at the last year, TGTX shows a very strong growth in Revenue. The Revenue has grown by 1338.63%.
- TGTX shows a strong growth in Revenue. Measured over the last years, the Revenue has been growing by 335.01% yearly.
- Based on estimates for the next years, TGTX will show a very strong growth in Earnings Per Share. The EPS will grow by 229.97% on average per year.
- TGTX is expected to show a strong growth in Revenue. In the coming years, the Revenue will grow by 41.13% yearly.
Valuation Analysis for NASDAQ:TGTX
ChartMill assigns a Valuation Rating to each stock, ranging from 0 to 10. This rating is calculated by analyzing different valuation elements, such as price to earnings and free cash flow, both in absolute terms and relative to the market and industry. In the case of NASDAQ:TGTX, the assigned 6 reflects its valuation:
- 95.25% of the companies in the same industry are more expensive than TGTX, based on the Price/Earnings ratio.
- TGTX's Price/Forward Earnings ratio is rather cheap when compared to the industry. TGTX is cheaper than 93.66% of the companies in the same industry.
- TGTX's Enterprise Value to EBITDA ratio is rather cheap when compared to the industry. TGTX is cheaper than 94.72% of the companies in the same industry.
- TGTX's Price/Free Cash Flow ratio is rather cheap when compared to the industry. TGTX is cheaper than 95.25% of the companies in the same industry.
- The low PEG Ratio(NY), which compensates the Price/Earnings for growth, indicates a rather cheap valuation of the company.
- A more expensive valuation may be justified as TGTX's earnings are expected to grow with 439.37% in the coming years.
Evaluating Health: NASDAQ:TGTX
ChartMill utilizes a Health Rating to assess stocks, scoring them on a scale of 0 to 10. This rating takes into account a variety of liquidity and solvency ratios, both in absolute terms and in comparison to industry peers. NASDAQ:TGTX has earned a 7 out of 10:
- TGTX has an Altman-Z score of 6.18. This indicates that TGTX is financially healthy and has little risk of bankruptcy at the moment.
- TGTX has a better Altman-Z score (6.18) than 81.34% of its industry peers.
- TGTX has a debt to FCF ratio of 1.51. This is a very positive value and a sign of high solvency as it would only need 1.51 years to pay back of all of its debts.
- TGTX has a better Debt to FCF ratio (1.51) than 96.30% of its industry peers.
- Even though the debt/equity ratio score it not favorable for TGTX, it has very limited outstanding debt, so we won't put too much weight on the DE evaluation.
- A Current Ratio of 3.58 indicates that TGTX has no problem at all paying its short term obligations.
- A Quick Ratio of 2.83 indicates that TGTX has no problem at all paying its short term obligations.
Profitability Analysis for NASDAQ:TGTX
ChartMill employs its own Profitability Rating system for stock evaluation. This score, ranging from 0 to 10, is derived from an analysis of diverse profitability metrics and margins. In the case of NASDAQ:TGTX, the assigned 5 is noteworthy for profitability:
- TGTX's Return On Assets of 23.84% is amongst the best of the industry. TGTX outperforms 98.94% of its industry peers.
- The Return On Equity of TGTX (53.87%) is better than 99.30% of its industry peers.
- TGTX has a Return On Invested Capital of 27.51%. This is amongst the best in the industry. TGTX outperforms 99.47% of its industry peers.
- TGTX's Profit Margin of 27.59% is amongst the best of the industry. TGTX outperforms 98.06% of its industry peers.
- The Operating Margin of TGTX (29.38%) is better than 98.24% of its industry peers.
- TGTX's Gross Margin of 92.76% is amongst the best of the industry. TGTX outperforms 94.37% of its industry peers.
More Affordable Growth stocks can be found in our Affordable Growth screener.
Check the latest full fundamental report of TGTX for a complete fundamental analysis.
Disclaimer
This article should in no way be interpreted as advice. The article is based on the observed metrics at the time of writing, but you should always make your own analysis and trade or invest at your own responsibility.