
Despite its growth, NASDAQ:TGTX remains within the realm of affordability.
By Mill Chart
Last update: Sep 18, 2024
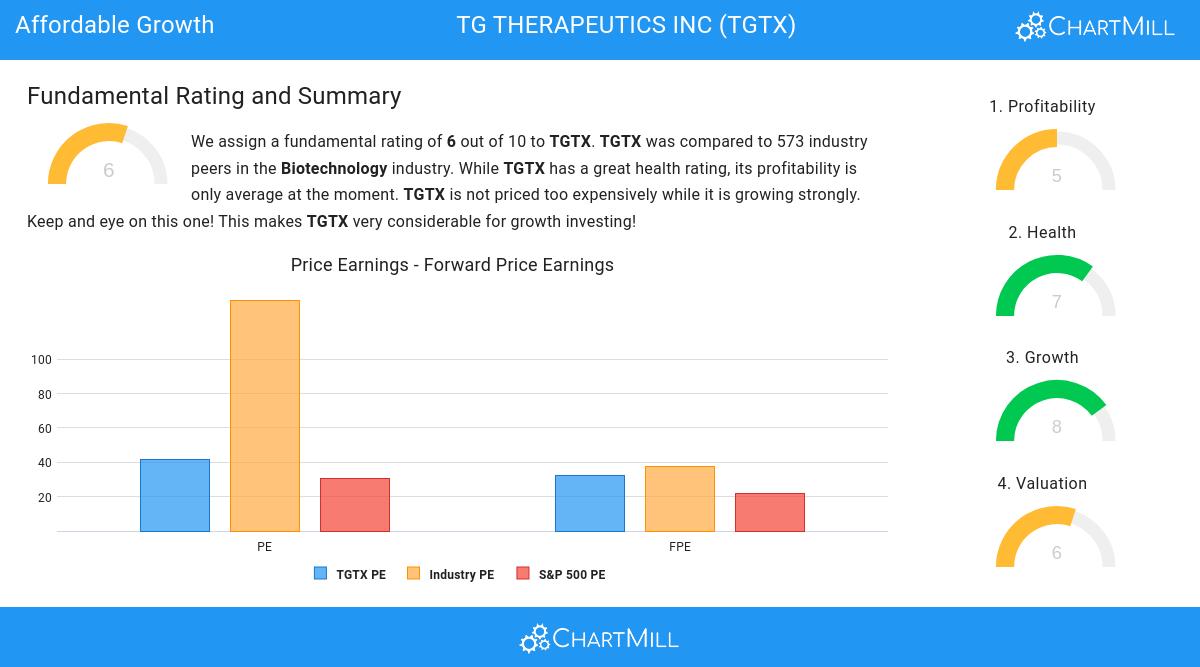
TG THERAPEUTICS INC (NASDAQ:TGTX) has caught the eye of our stock screener as an affordable growth stock. NASDAQ:TGTX is displaying robust growth metrics and also excels in terms of profitability, solvency, and liquidity. Additionally, it appears to be reasonably priced. Let's delve into the details.
Growth Analysis for NASDAQ:TGTX
ChartMill employs its own Growth Rating system for all stocks. This score, ranging from 0 to 10, is derived by evaluating different growth factors, such as EPS and revenue growth, taking into account both past performance and future projections. NASDAQ:TGTX has earned a 8 for growth:
- TGTX shows a strong growth in Earnings Per Share. In the last year, the EPS has been growing by 147.24%, which is quite impressive.
- Looking at the last year, TGTX shows a very strong growth in Revenue. The Revenue has grown by 1338.63%.
- Measured over the past years, TGTX shows a very strong growth in Revenue. The Revenue has been growing by 335.01% on average per year.
- The Earnings Per Share is expected to grow by 229.97% on average over the next years. This is a very strong growth
- Based on estimates for the next years, TGTX will show a very strong growth in Revenue. The Revenue will grow by 41.13% on average per year.
Valuation Examination for NASDAQ:TGTX
An integral part of ChartMill's stock analysis is the Valuation Rating, which spans from 0 to 10. This rating evaluates diverse valuation factors, including price to earnings and cash flows, while considering the stock's profitability and growth. NASDAQ:TGTX has received a 6 out of 10:
- 95.25% of the companies in the same industry are more expensive than TGTX, based on the Price/Earnings ratio.
- TGTX's Price/Forward Earnings ratio is rather cheap when compared to the industry. TGTX is cheaper than 92.96% of the companies in the same industry.
- Based on the Enterprise Value to EBITDA ratio, TGTX is valued cheaply inside the industry as 94.72% of the companies are valued more expensively.
- 95.25% of the companies in the same industry are more expensive than TGTX, based on the Price/Free Cash Flow ratio.
- TGTX's low PEG Ratio(NY), which compensates the Price/Earnings for growth, indicates a rather cheap valuation of the company.
- A more expensive valuation may be justified as TGTX's earnings are expected to grow with 439.37% in the coming years.
Deciphering NASDAQ:TGTX's Health Rating
A critical element of ChartMill's stock evaluation is the Health Rating, which spans from 0 to 10. This rating considers multiple health factors, including liquidity and solvency, both in absolute terms and relative to industry peers. NASDAQ:TGTX has received a 7 out of 10:
- TGTX has an Altman-Z score of 7.53. This indicates that TGTX is financially healthy and has little risk of bankruptcy at the moment.
- TGTX has a Altman-Z score of 7.53. This is amongst the best in the industry. TGTX outperforms 82.92% of its industry peers.
- The Debt to FCF ratio of TGTX is 1.51, which is an excellent value as it means it would take TGTX, only 1.51 years of fcf income to pay off all of its debts.
- TGTX has a Debt to FCF ratio of 1.51. This is amongst the best in the industry. TGTX outperforms 96.48% of its industry peers.
- Although TGTX does not score too well on debt/equity it has very limited outstanding debt, which is well covered by the FCF. We will not put too much weight on the debt/equity number as it may be because of low equity, which could be a consequence of a share buyback program for instance. This needs to be investigated.
- A Current Ratio of 3.58 indicates that TGTX has no problem at all paying its short term obligations.
- TGTX has a Quick Ratio of 2.83. This indicates that TGTX is financially healthy and has no problem in meeting its short term obligations.
Profitability Examination for NASDAQ:TGTX
ChartMill employs its own Profitability Rating system for stock evaluation. This score, ranging from 0 to 10, is derived from an analysis of diverse profitability metrics and margins. In the case of NASDAQ:TGTX, the assigned 5 is noteworthy for profitability:
- The Return On Assets of TGTX (23.84%) is better than 98.94% of its industry peers.
- TGTX's Return On Equity of 53.87% is amongst the best of the industry. TGTX outperforms 99.30% of its industry peers.
- TGTX's Return On Invested Capital of 27.51% is amongst the best of the industry. TGTX outperforms 99.47% of its industry peers.
- TGTX has a Profit Margin of 27.59%. This is amongst the best in the industry. TGTX outperforms 97.89% of its industry peers.
- TGTX has a better Operating Margin (29.38%) than 98.24% of its industry peers.
- TGTX has a Gross Margin of 92.76%. This is amongst the best in the industry. TGTX outperforms 94.54% of its industry peers.
Our Affordable Growth screener lists more Affordable Growth stocks and is updated daily.
Our latest full fundamental report of TGTX contains the most current fundamental analsysis.
Keep in mind
This article should in no way be interpreted as advice. The article is based on the observed metrics at the time of writing, but you should always make your own analysis and trade or invest at your own responsibility.
NASDAQ:TGTX (4/16/2025, 2:08:55 PM)
37.83
-1.2 (-3.07%)
Find more stocks in the Stock Screener
TGTX Latest News and Analysis
 11 days ago - ChartmillApplying Mark Minervini’s growth stock checklist to TG THERAPEUTICS INC (NASDAQ:TGTX)
Why TG THERAPEUTICS INC (NASDAQ:TGTX) qualifies as a high growth stock. A fundamental and technical analysis of (NASDAQ:TGTX).
