
Teleflex (NYSE:TFX) Misses Q4 Sales Targets, Stock Drops
Provided By StockStory
Last update: Feb 27, 2025

Medical technology company Teleflex (NYSE:TFX) missed Wall Street’s revenue expectations in Q4 CY2024 as sales rose 2.8% year on year to $795.4 million. Its non-GAAP profit of $3.89 per share was in line with analysts’ consensus estimates.
Is now the time to buy Teleflex? Find out by accessing our full research report, it’s free.
Teleflex (TFX) Q4 CY2024 Highlights:
- Revenue: $795.4 million vs analyst estimates of $814.5 million (2.8% year-on-year growth, 2.3% miss)
- Adjusted EPS: $3.89 vs analyst expectations of $3.88 (in line)
- Operating Margin: -13.9%, down from 10.7% in the same quarter last year
- Free Cash Flow Margin: 21.4%, up from 14.4% in the same quarter last year
- Constant Currency Revenue rose 3.2% year on year (0.7% in the same quarter last year)
- Market Capitalization: $8.25 billion
"In the fourth quarter, we delivered strong double-digit adjusted earnings per share growth" said Liam Kelly, Teleflex's Chairman, President and Chief Executive Officer.
Company Overview
Founded in 1943, Teleflex (NYSE:TFX) designs, develops, and manufactures medical devices used in critical care, surgical applications, and interventional procedures.
Surgical Equipment & Consumables - Specialty
The surgical equipment and consumables industry provides tools, devices, and disposable products essential for surgeries and medical procedures. These companies therefore benefit from relatively consistent demand, driven by the ongoing need for medical interventions, recurring revenue from consumables, and long-term contracts with hospitals and healthcare providers. However, the high costs of R&D and regulatory compliance, coupled with intense competition and pricing pressures from cost-conscious customers, can constrain profitability. Over the next few years, tailwinds include aging populations, which tend to need surgical interventions at higher rates. The increasing integration of AI and robotics into surgical procedures could also create opportunities for differentiation and innovation. However, the industry faces headwinds including potential supply chain vulnerabilities, evolving regulatory requirements, and more widespread efforts to make healthcare less costly.
Sales Growth
A company’s long-term sales performance is one signal of its overall quality. Even a bad business can shine for one or two quarters, but a top-tier one grows for years. Unfortunately, Teleflex’s 3.4% annualized revenue growth over the last five years was tepid. This fell short of our benchmark for the healthcare sector and is a rough starting point for our analysis.
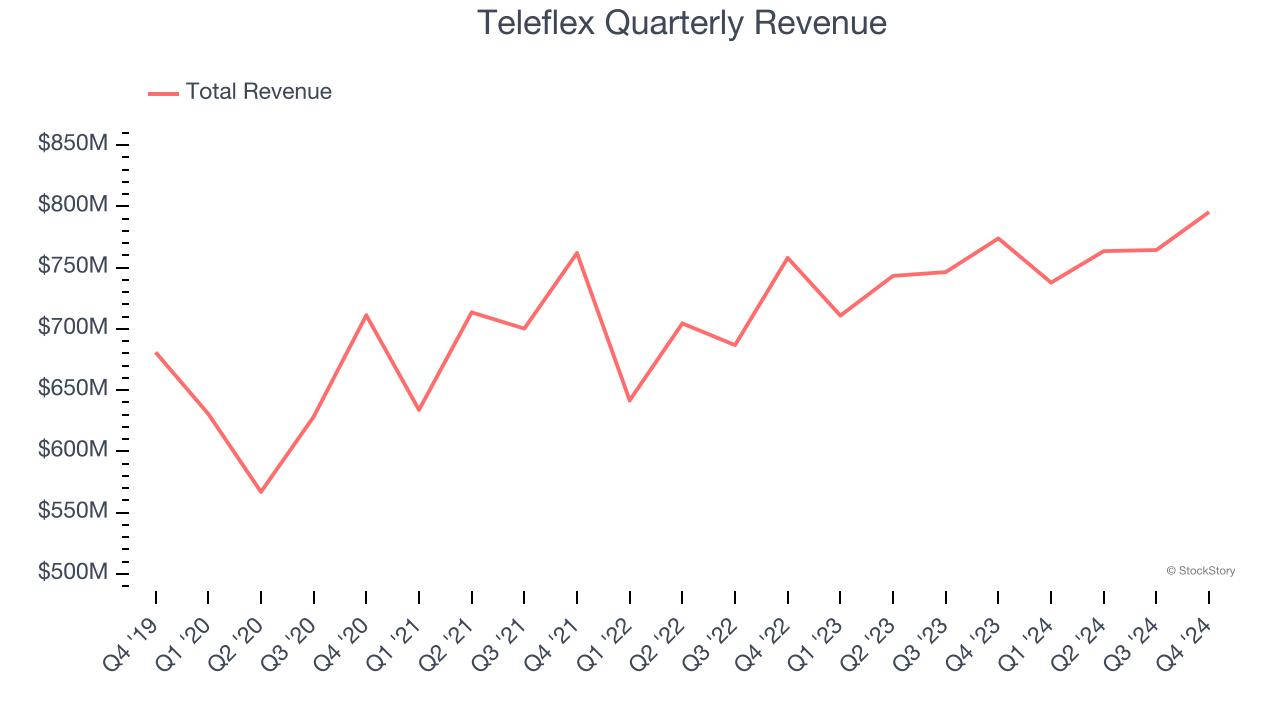
Long-term growth is the most important, but within healthcare, a half-decade historical view may miss new innovations or demand cycles. Teleflex’s annualized revenue growth of 4.7% over the last two years is above its five-year trend, but we were still disappointed by the results. 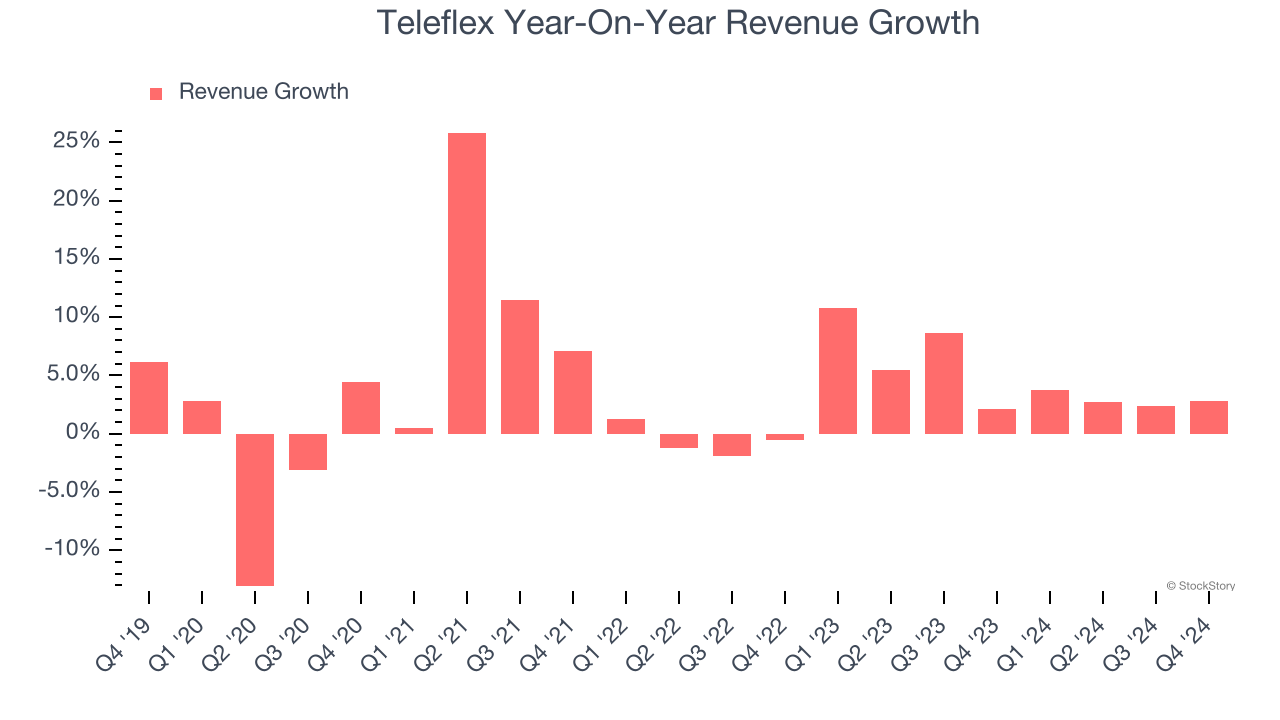
We can better understand the company’s sales dynamics by analyzing its constant currency revenue, which excludes currency movements that are outside their control and not indicative of demand. Over the last two years, its constant currency sales averaged 4.7% year-on-year growth. Because this number aligns with its normal revenue growth, we can see Teleflex’s foreign exchange rates have been steady. 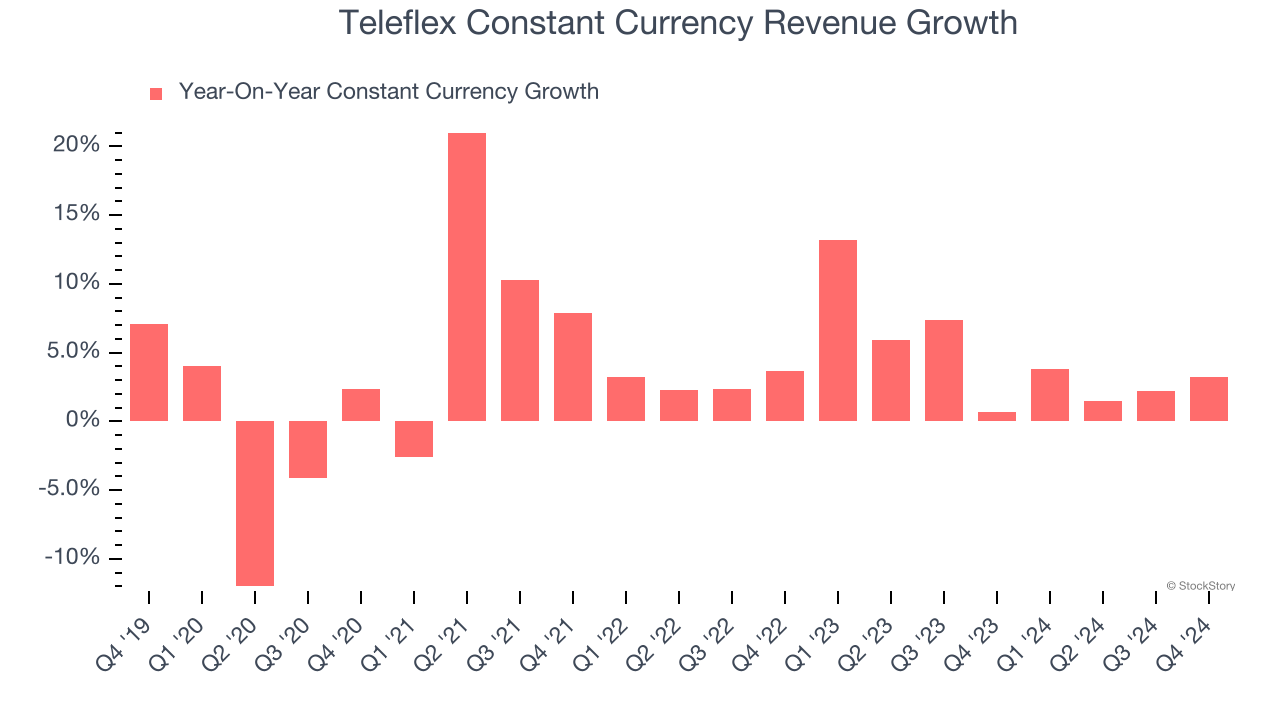
This quarter, Teleflex’s revenue grew by 2.8% year on year to $795.4 million, falling short of Wall Street’s estimates.
Looking ahead, sell-side analysts expect revenue to grow 5.2% over the next 12 months, similar to its two-year rate. This projection is above the sector average and implies its newer products and services will help sustain its recent top-line performance.
Software is eating the world and there is virtually no industry left that has been untouched by it. That drives increasing demand for tools helping software developers do their jobs, whether it be monitoring critical cloud infrastructure, integrating audio and video functionality, or ensuring smooth content streaming. Click here to access a free report on our 3 favorite stocks to play this generational megatrend.
Operating Margin
Teleflex has managed its cost base well over the last five years. It demonstrated solid profitability for a healthcare business, producing an average operating margin of 15.6%.
Looking at the trend in its profitability, Teleflex’s operating margin decreased by 11.7 percentage points over the last five years. This performance was caused by more recent speed bumps as the company’s margin fell by 13 percentage points on a two-year basis. We’re disappointed in these results because it shows its expenses were rising and it couldn’t pass those costs onto its customers.
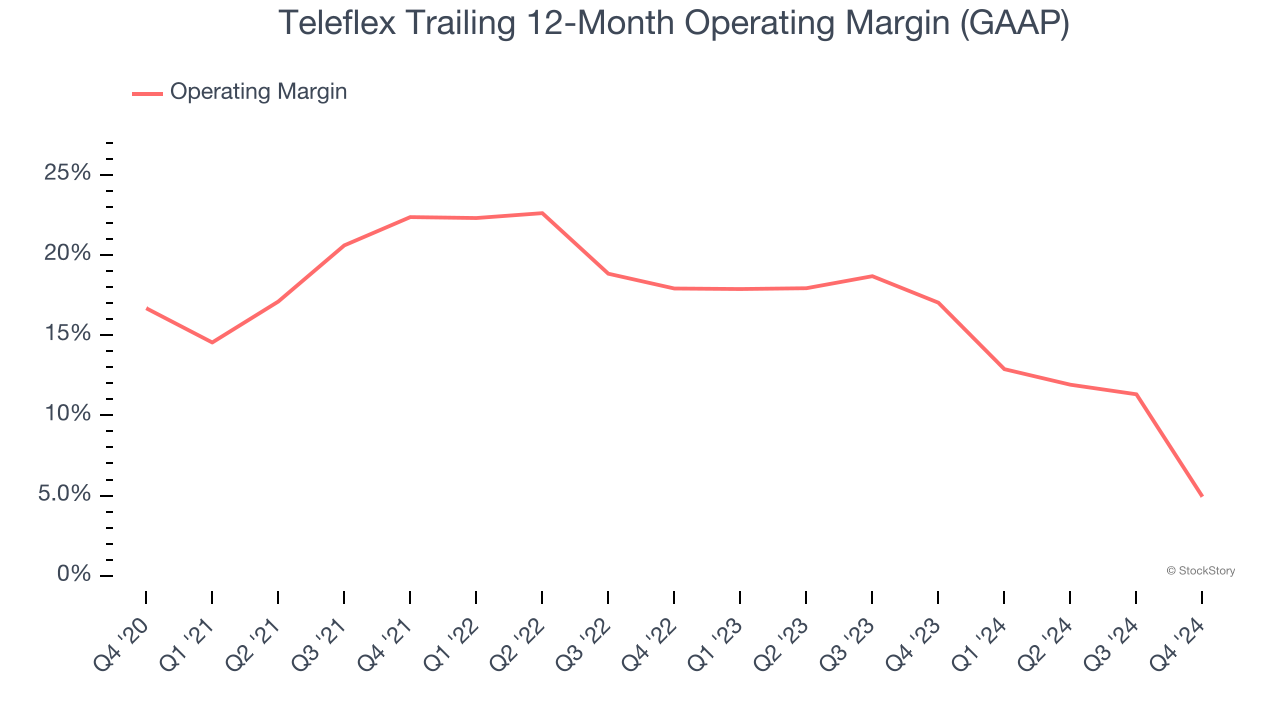
This quarter, Teleflex generated an operating profit margin of negative 13.9%, down 24.5 percentage points year on year. This contraction shows it was recently less efficient because its expenses grew faster than its revenue.
Earnings Per Share
We track the long-term change in earnings per share (EPS) for the same reason as long-term revenue growth. Compared to revenue, however, EPS highlights whether a company’s growth is profitable.
Teleflex’s EPS grew at an unimpressive 4.7% compounded annual growth rate over the last five years. This performance was better than its flat revenue but doesn’t tell us much about its business quality because its operating margin didn’t expand.
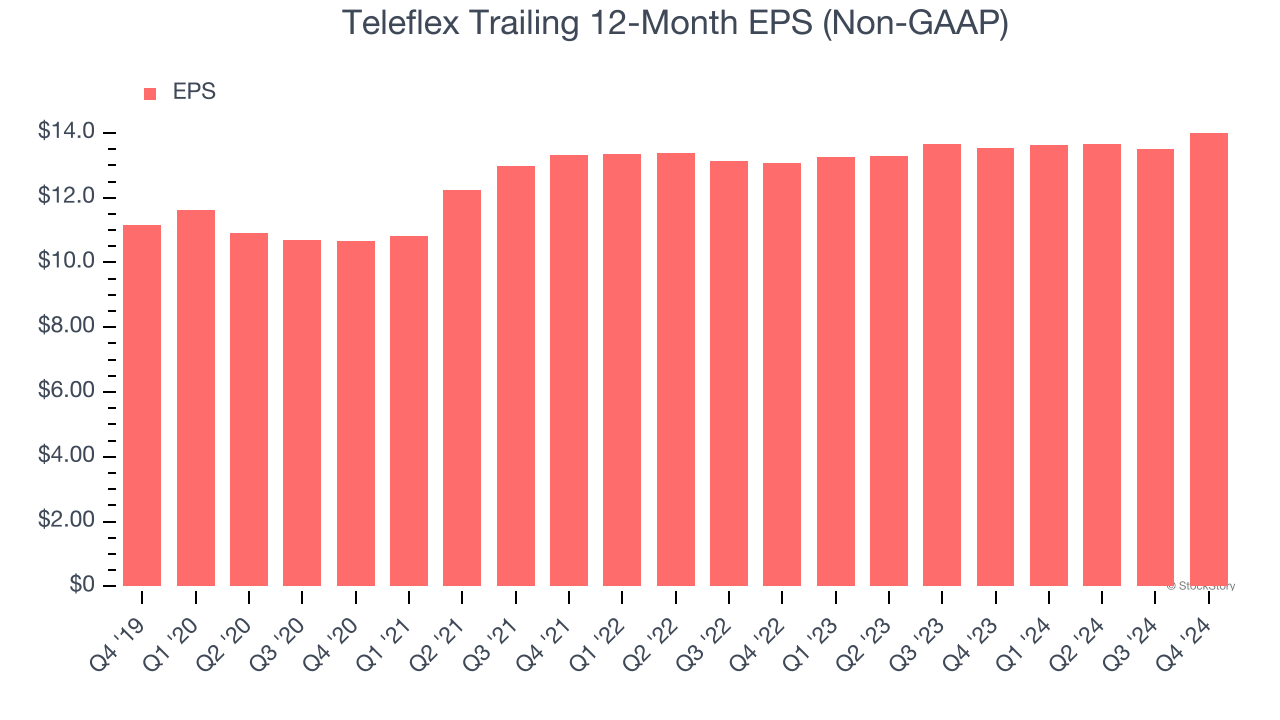
We can take a deeper look into Teleflex’s earnings to better understand the drivers of its performance. A five-year view shows that Teleflex has repurchased its stock, shrinking its share count by 1.8%. This tells us its EPS outperformed its revenue not because of increased operational efficiency but financial engineering, as buybacks boost per share earnings. 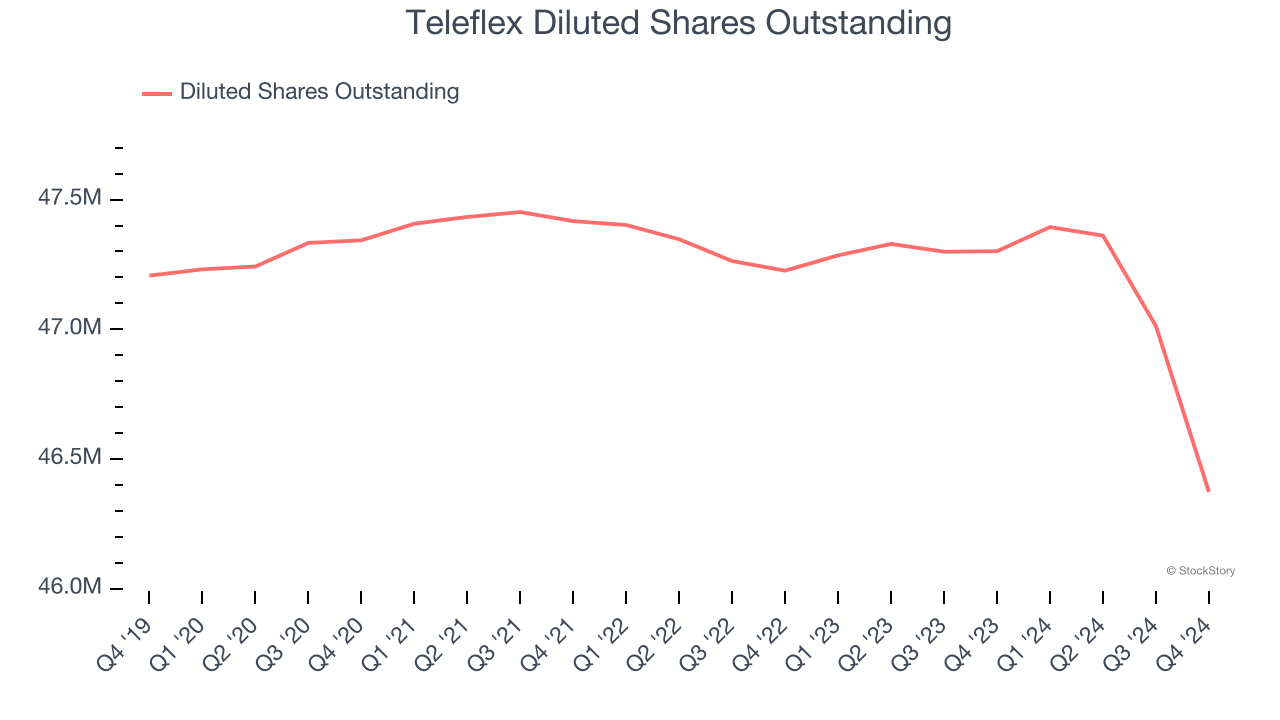
In Q4, Teleflex reported EPS at $3.89, up from $3.38 in the same quarter last year. This print was close to analysts’ estimates. Over the next 12 months, Wall Street expects Teleflex’s full-year EPS of $14.01 to grow 8.4%.
Key Takeaways from Teleflex’s Q4 Results
We struggled to find many positives in these results. Its revenue missed significantly and its constant currency revenue fell short of Wall Street’s estimates. Overall, this quarter could have been better. The stock traded down 9.8% to $160 immediately after reporting.
Teleflex’s earnings report left more to be desired. Let’s look forward to see if this quarter has created an opportunity to buy the stock. The latest quarter does matter, but not nearly as much as longer-term fundamentals and valuation, when deciding if the stock is a buy. We cover that in our actionable full research report which you can read here, it’s free.
NYSE:TFX (2/28/2025, 1:06:09 PM)
132.24
-6.87 (-4.94%)
Find more stocks in the Stock Screener
TFX Latest News and Analysis
 16 minutes ago - ChartmillLet's take a look at the S&P500 stocks that are experiencing unusual volume in today's session.
Let's have a look at what is happening on the US markets on Friday. Below you can find the S&P500 stocks with an unusual volume in today's session.
 a day ago - ChartmillStay informed with the top movers within the S&P500 index on Thursday.
Curious about the S&P500 stocks that are in motion on Thursday? Join us as we explore the top movers within the S&P500 index during today's session.
a day ago - ChartmillUnusual volume S&P500 stocks in Thursday's sessionCurious about which S&P500 stocks are generating unusual volume on Thursday? Find out below.
a day ago - ChartmillDiscover which S&P500 stocks are making waves on Thursday.Wondering what's happening in today's session for the S&P500 index? Stay informed with the top movers within the S&P500 index on Thursday.
 a day ago - ChartmillGapping S&P500 stocks in Thursday's session
Wondering what's happening in today's session regarding gap up and gap down stocks? Explore the S&P500 index on Thursday to uncover the stocks that are gapping in the S&P500 index.
 a day ago - ChartmillGet insights into the top movers in the S&P500 index of Thursday's pre-market session.
Pre-market stock analysis of S&P500 stocks on 2025-02-27: top gainers and losers in today's session.
