
NYSE:TEX stands out as a stock that provides good value for the fundamentals it showcases.
By Mill Chart
Last update: Oct 22, 2024
Our stock screener has singled out TEREX CORP (NYSE:TEX) as a stellar value proposition. NYSE:TEX not only scores well in profitability, solvency, and liquidity but also maintains a very reasonable price point. We'll explore this further.
Valuation Examination for NYSE:TEX
An integral part of ChartMill's stock analysis is the Valuation Rating, which spans from 0 to 10. This rating evaluates diverse valuation factors, including price to earnings and cash flows, while considering the stock's profitability and growth. NYSE:TEX has received a 8 out of 10:
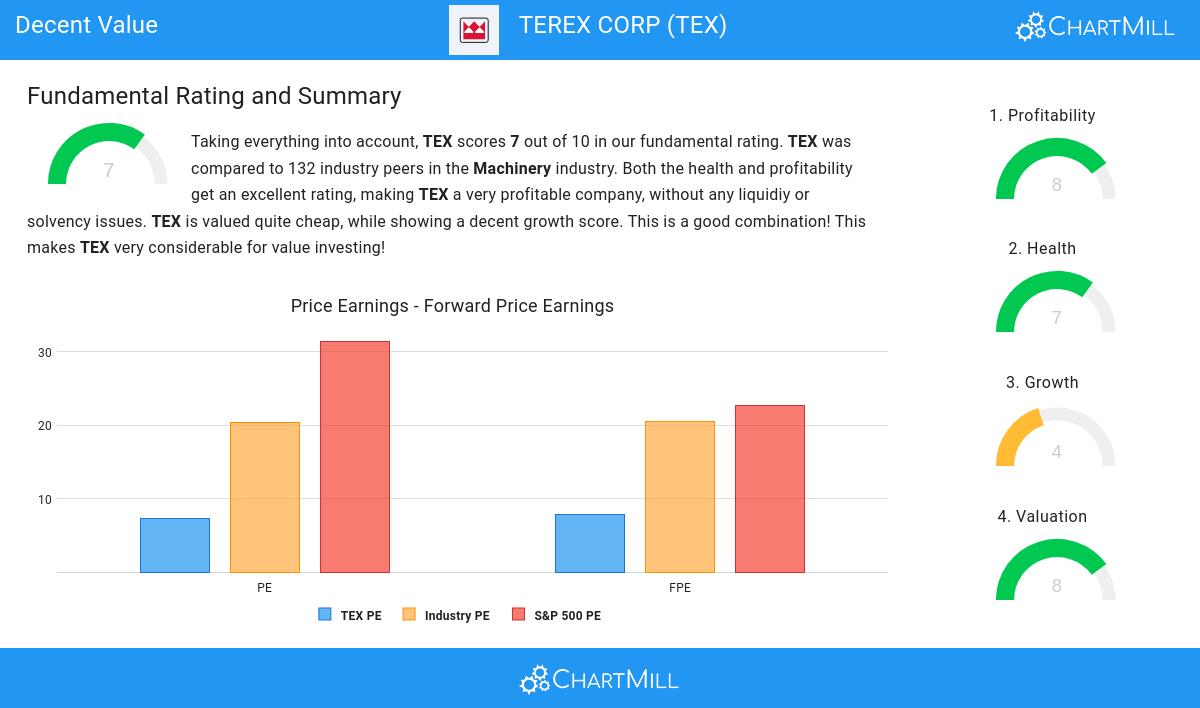
- With a Price/Earnings ratio of 7.32, the valuation of TEX can be described as very cheap.
- TEX's Price/Earnings ratio is rather cheap when compared to the industry. TEX is cheaper than 93.80% of the companies in the same industry.
- Compared to an average S&P500 Price/Earnings ratio of 31.46, TEX is valued rather cheaply.
- Based on the Price/Forward Earnings ratio of 7.77, the valuation of TEX can be described as very cheap.
- TEX's Price/Forward Earnings ratio is rather cheap when compared to the industry. TEX is cheaper than 96.12% of the companies in the same industry.
- The average S&P500 Price/Forward Earnings ratio is at 22.63. TEX is valued rather cheaply when compared to this.
- Compared to the rest of the industry, the Enterprise Value to EBITDA ratio of TEX indicates a rather cheap valuation: TEX is cheaper than 94.57% of the companies listed in the same industry.
- Based on the Price/Free Cash Flow ratio, TEX is valued a bit cheaper than 77.52% of the companies in the same industry.
- TEX has an outstanding profitability rating, which may justify a higher PE ratio.
Assessing Profitability for NYSE:TEX
ChartMill's Profitability Rating offers a unique perspective on stock analysis, providing scores from 0 to 10. These ratings consider a wide range of profitability metrics and margins, both in comparison to industry peers and on their own merits. For NYSE:TEX, the assigned 8 is a significant indicator of profitability:
- Looking at the Return On Assets, with a value of 13.10%, TEX belongs to the top of the industry, outperforming 88.37% of the companies in the same industry.
- The Return On Equity of TEX (27.16%) is better than 89.15% of its industry peers.
- With an excellent Return On Invested Capital value of 20.02%, TEX belongs to the best of the industry, outperforming 93.80% of the companies in the same industry.
- Measured over the past 3 years, the Average Return On Invested Capital for TEX is significantly above the industry average of 11.31%.
- The last Return On Invested Capital (20.02%) for TEX is above the 3 year average (17.81%), which is a sign of increasing profitability.
- TEX has a Profit Margin of 9.55%. This is in the better half of the industry: TEX outperforms 68.99% of its industry peers.
- TEX's Profit Margin has improved in the last couple of years.
- TEX has a better Operating Margin (12.15%) than 61.24% of its industry peers.
- TEX's Operating Margin has improved in the last couple of years.
Understanding NYSE:TEX's Health
ChartMill assigns a proprietary Health Rating to each stock. The score is computed by evaluating various liquidity and solvency ratios and ranges from 0 to 10. NYSE:TEX was assigned a score of 7 for health:
- An Altman-Z score of 4.15 indicates that TEX is not in any danger for bankruptcy at the moment.
- TEX has a better Altman-Z score (4.15) than 68.99% of its industry peers.
- TEX has a debt to FCF ratio of 3.10. This is a good value and a sign of high solvency as TEX would need 3.10 years to pay back of all of its debts.
- TEX has a Debt to FCF ratio of 3.10. This is in the better half of the industry: TEX outperforms 68.22% of its industry peers.
- TEX has a Debt/Equity ratio of 0.36. This is a healthy value indicating a solid balance between debt and equity.
- A Current Ratio of 2.21 indicates that TEX has no problem at all paying its short term obligations.
Growth Examination for NYSE:TEX
ChartMill assigns a proprietary Growth Rating to each stock. The score is computed by evaluating various growth aspects, like EPS and revenue growth. We take into account the history as well as the estimated future numbers. NYSE:TEX was assigned a score of 4 for growth:
- TEX shows a strong growth in Earnings Per Share. In the last year, the EPS has been growing by 13.04%, which is quite good.
- TEX shows a strong growth in Earnings Per Share. Measured over the last years, the EPS has been growing by 22.78% yearly.
- When comparing the Revenue growth rate of the last years to the growth rate of the upcoming years, we see that the growth is accelerating.
More Decent Value stocks can be found in our Decent Value screener.
For an up to date full fundamental analysis you can check the fundamental report of TEX
Disclaimer
Important Note: The content of this article is not intended as trading advice. It is essential to perform your own analysis and exercise caution when making trading decisions. The article presents observations created by automated analysis but does not guarantee any trading or investment outcomes. Always trade responsibly and make independent judgments.
