
When you look at NYSE:TEX, it's hard to ignore the strong fundamentals, especially considering its likely undervaluation.
By Mill Chart
Last update: Sep 23, 2024
Consider TEREX CORP (NYSE:TEX) as a top value stock, identified by our stock screening tool. NYSE:TEX shines in terms of profitability, solvency, and liquidity, all while remaining very reasonably priced. Let's dive deeper into the analysis.
A Closer Look at Valuation for NYSE:TEX
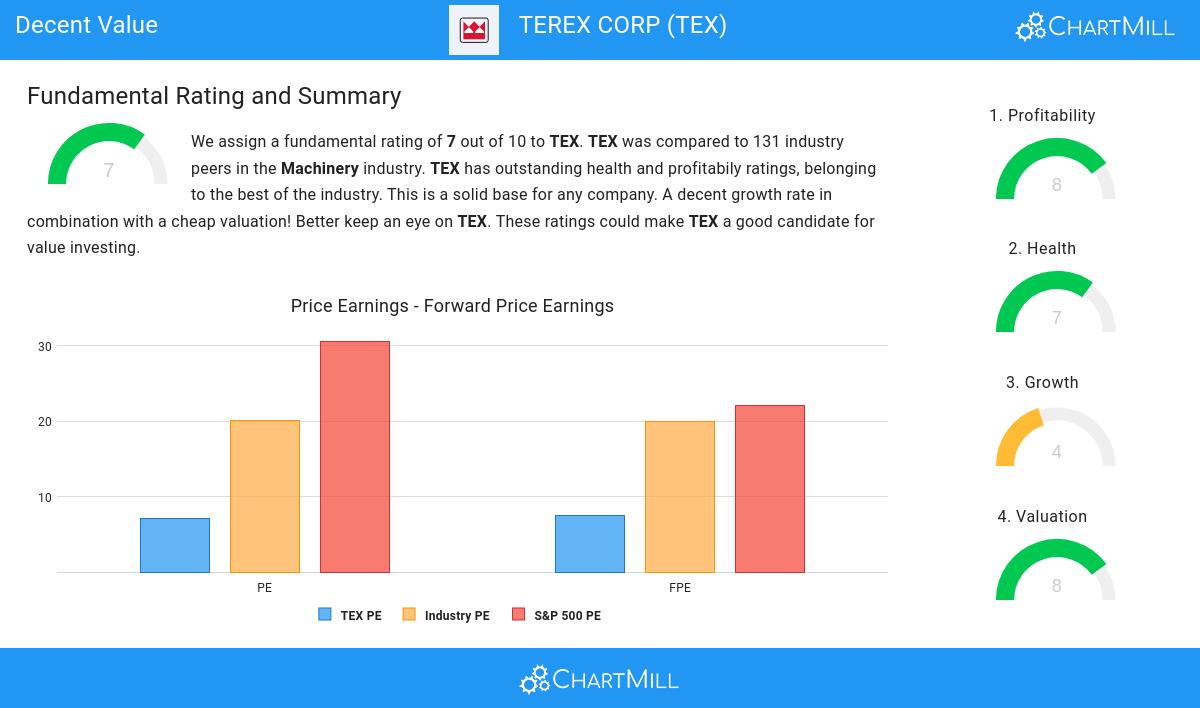
ChartMill assigns a proprietary Valuation Rating to each stock. The score is computed by evaluating various valuation aspects, like price to earnings and free cash flow, both absolutely as relative to the market and industry. NYSE:TEX was assigned a score of 8 for valuation:
- With a Price/Earnings ratio of 7.04, the valuation of TEX can be described as very cheap.
- Based on the Price/Earnings ratio, TEX is valued cheaply inside the industry as 94.57% of the companies are valued more expensively.
- TEX's Price/Earnings ratio indicates a rather cheap valuation when compared to the S&P500 average which is at 30.59.
- TEX is valuated cheaply with a Price/Forward Earnings ratio of 7.48.
- Based on the Price/Forward Earnings ratio, TEX is valued cheaper than 96.90% of the companies in the same industry.
- The average S&P500 Price/Forward Earnings ratio is at 22.11. TEX is valued rather cheaply when compared to this.
- Based on the Enterprise Value to EBITDA ratio, TEX is valued cheaply inside the industry as 95.35% of the companies are valued more expensively.
- Based on the Price/Free Cash Flow ratio, TEX is valued a bit cheaper than 79.07% of the companies in the same industry.
- TEX has an outstanding profitability rating, which may justify a higher PE ratio.
What does the Profitability looks like for NYSE:TEX
ChartMill's Profitability Rating offers a unique perspective on stock analysis, providing scores from 0 to 10. These ratings consider a wide range of profitability metrics and margins, both in comparison to industry peers and on their own merits. For NYSE:TEX, the assigned 8 is a significant indicator of profitability:
- With an excellent Return On Assets value of 13.10%, TEX belongs to the best of the industry, outperforming 87.60% of the companies in the same industry.
- With an excellent Return On Equity value of 27.16%, TEX belongs to the best of the industry, outperforming 89.15% of the companies in the same industry.
- TEX has a Return On Invested Capital of 20.02%. This is amongst the best in the industry. TEX outperforms 93.80% of its industry peers.
- TEX had an Average Return On Invested Capital over the past 3 years of 17.81%. This is significantly above the industry average of 11.21%.
- The 3 year average ROIC (17.81%) for TEX is below the current ROIC(20.02%), indicating increased profibility in the last year.
- With a decent Profit Margin value of 9.55%, TEX is doing good in the industry, outperforming 68.99% of the companies in the same industry.
- TEX's Profit Margin has improved in the last couple of years.
- TEX has a Operating Margin of 12.15%. This is in the better half of the industry: TEX outperforms 61.24% of its industry peers.
- TEX's Operating Margin has improved in the last couple of years.
Evaluating Health: NYSE:TEX
Every stock is evaluated by ChartMill, receiving a Health Rating on a scale of 0 to 10. This assessment considers different health aspects, including liquidity and solvency, both in absolute terms and relative to industry peers. NYSE:TEX has achieved a 7 out of 10:
- An Altman-Z score of 4.11 indicates that TEX is not in any danger for bankruptcy at the moment.
- TEX's Altman-Z score of 4.11 is fine compared to the rest of the industry. TEX outperforms 68.99% of its industry peers.
- The Debt to FCF ratio of TEX is 3.10, which is a good value as it means it would take TEX, 3.10 years of fcf income to pay off all of its debts.
- TEX has a better Debt to FCF ratio (3.10) than 68.22% of its industry peers.
- A Debt/Equity ratio of 0.36 indicates that TEX is not too dependend on debt financing.
- TEX has a Current Ratio of 2.21. This indicates that TEX is financially healthy and has no problem in meeting its short term obligations.
ChartMill's Evaluation of Growth
ChartMill employs its own Growth Rating system for all stocks. This score, ranging from 0 to 10, is derived by evaluating different growth factors, such as EPS and revenue growth, taking into account both past performance and future projections. NYSE:TEX has earned a 4 for growth:
- The Earnings Per Share has grown by an nice 13.04% over the past year.
- TEX shows a strong growth in Earnings Per Share. Measured over the last years, the EPS has been growing by 22.78% yearly.
- The Revenue growth rate is accelerating: in the next years the growth will be better than in the last years.
Our Decent Value screener lists more Decent Value stocks and is updated daily.
Check the latest full fundamental report of TEX for a complete fundamental analysis.
Keep in mind
Important Note: The content of this article is not intended as trading advice. It is essential to perform your own analysis and exercise caution when making trading decisions. The article presents observations created by automated analysis but does not guarantee any trading or investment outcomes. Always trade responsibly and make independent judgments.
