
Why NYSE:TEL is a Top Pick for Dividend Investors.
By Mill Chart
Last update: Oct 4, 2024
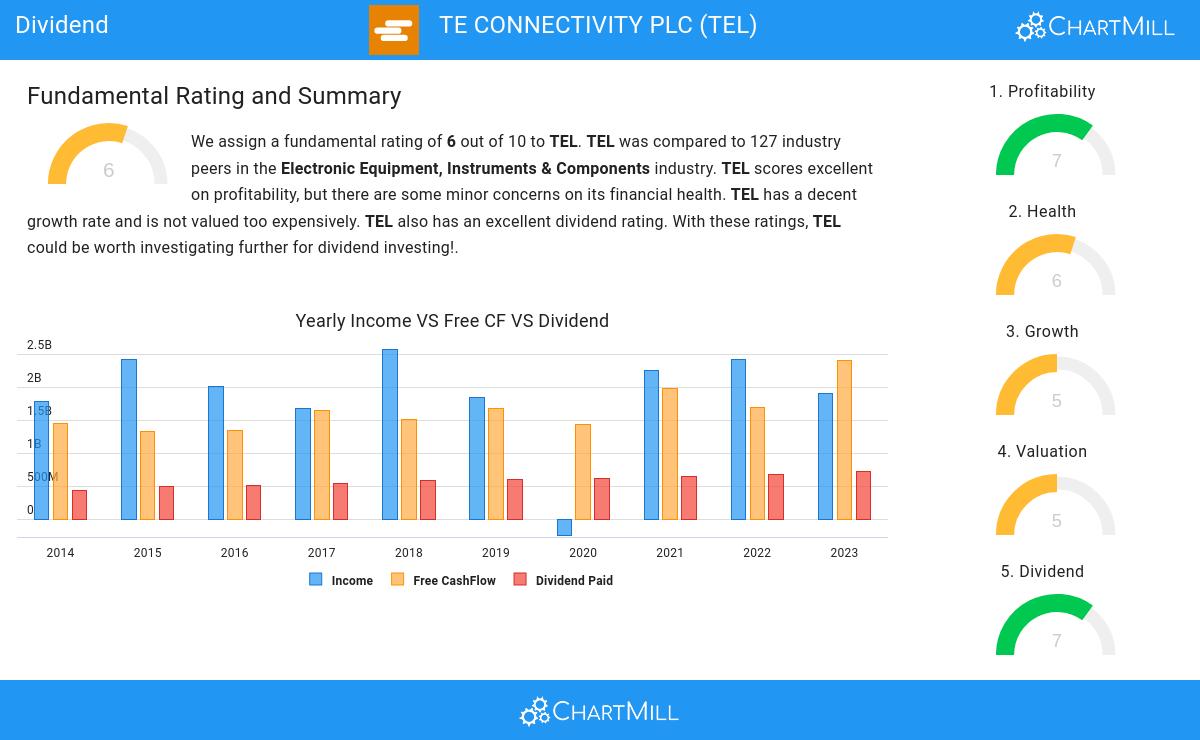
TE CONNECTIVITY PLC (NYSE:TEL) was identified as a stock worth exploring by dividend investors by our stock screener. NYSE:TEL scores well on profitability, solvency and liquidity. At the same time it seems to pay a decent dividend. We'll explore this a bit deeper below.
Dividend Insights: NYSE:TEL
An integral part of ChartMill's stock analysis is the Dividend Rating, which spans from 0 to 10. This rating evaluates diverse dividend factors, including yield, historical data, growth, and sustainability. NYSE:TEL has received a 7 out of 10:
- TEL's Dividend Yield is rather good when compared to the industry average which is at 1.91. TEL pays more dividend than 92.86% of the companies in the same industry.
- The dividend of TEL is nicely growing with an annual growth rate of 6.41%!
- TEL has been paying a dividend for at least 10 years, so it has a reliable track record.
- TEL has not decreased their dividend for at least 10 years, which is a reliable track record.
- 21.56% of the earnings are spent on dividend by TEL. This is a low number and sustainable payout ratio.
- TEL's earnings are growing more than its dividend. This makes the dividend growth sustainable.
Health Insights: NYSE:TEL
A critical element of ChartMill's stock evaluation is the Health Rating, which spans from 0 to 10. This rating considers multiple health factors, including liquidity and solvency, both in absolute terms and relative to industry peers. NYSE:TEL has received a 6 out of 10:
- TEL has an Altman-Z score of 4.69. This indicates that TEL is financially healthy and has little risk of bankruptcy at the moment.
- With a decent Altman-Z score value of 4.69, TEL is doing good in the industry, outperforming 74.60% of the companies in the same industry.
- TEL has a debt to FCF ratio of 1.44. This is a very positive value and a sign of high solvency as it would only need 1.44 years to pay back of all of its debts.
- The Debt to FCF ratio of TEL (1.44) is better than 76.98% of its industry peers.
- A Debt/Equity ratio of 0.23 indicates that TEL is not too dependend on debt financing.
Looking at the Profitability
ChartMill employs its own Profitability Rating system for stock evaluation. This score, ranging from 0 to 10, is derived from an analysis of diverse profitability metrics and margins. In the case of NYSE:TEL, the assigned 7 is noteworthy for profitability:
- TEL has a better Return On Assets (15.15%) than 96.83% of its industry peers.
- Looking at the Return On Equity, with a value of 27.46%, TEL belongs to the top of the industry, outperforming 95.24% of the companies in the same industry.
- TEL has a Return On Invested Capital of 14.22%. This is amongst the best in the industry. TEL outperforms 90.48% of its industry peers.
- TEL had an Average Return On Invested Capital over the past 3 years of 14.34%. This is significantly above the industry average of 9.05%.
- TEL has a better Profit Margin (21.94%) than 96.83% of its industry peers.
- With an excellent Operating Margin value of 18.51%, TEL belongs to the best of the industry, outperforming 96.83% of the companies in the same industry.
More Best Dividend stocks can be found in our Best Dividend screener.
Our latest full fundamental report of TEL contains the most current fundamental analsysis.
Keep in mind
Important Note: The content of this article is not intended as trading advice. It is essential to perform your own analysis and exercise caution when making trading decisions. The article presents observations created by automated analysis but does not guarantee any trading or investment outcomes. Always trade responsibly and make independent judgments.
222.73
-4.18 (-1.84%)
Find more stocks in the Stock Screener
TEL Latest News and Analysis
