Why NYSE:TEL qualifies as a good dividend investing stock.
By Mill Chart
Last update: Sep 12, 2024
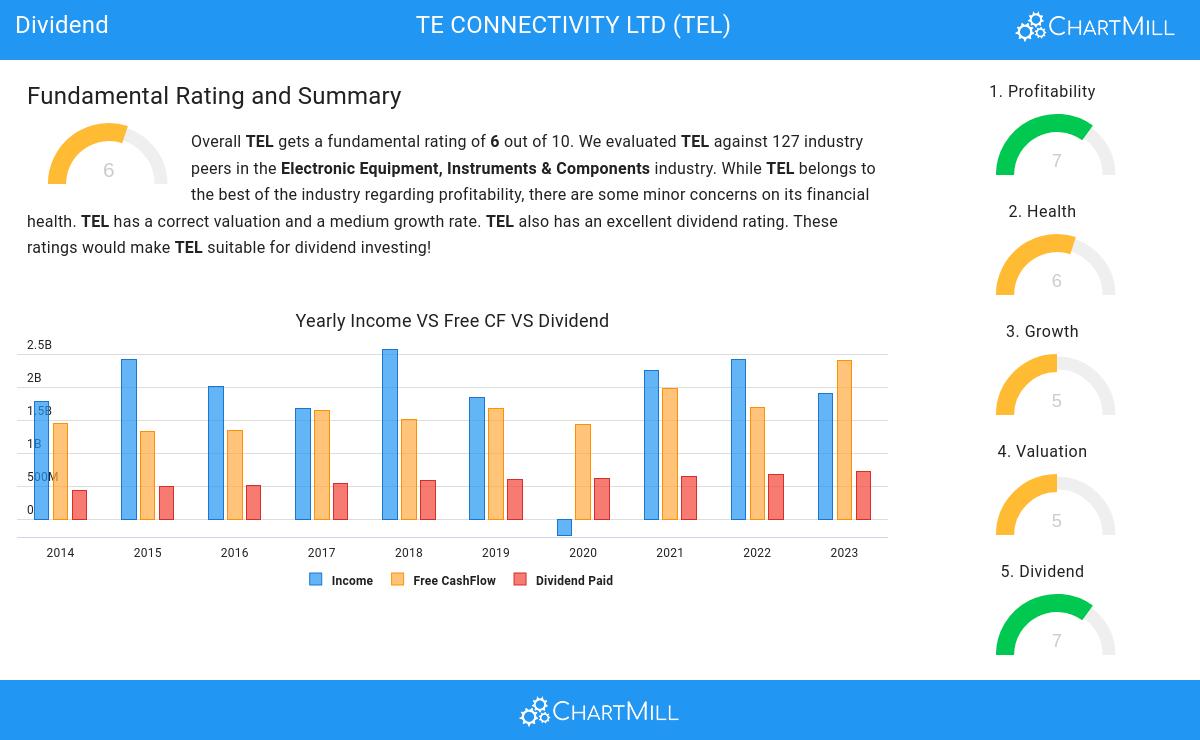
Our stock screening tool has identified TE CONNECTIVITY LTD (NYSE:TEL) as a strong dividend contender with robust fundamentals. NYSE:TEL exhibits commendable financial health and profitability, all while offering a sustainable dividend. Let's delve into each aspect below.
Dividend Assessment of NYSE:TEL
An integral part of ChartMill's stock analysis is the Dividend Rating, which spans from 0 to 10. This rating evaluates diverse dividend factors, including yield, historical data, growth, and sustainability. NYSE:TEL has received a 7 out of 10:
- TEL's Dividend Yield is rather good when compared to the industry average which is at 1.98. TEL pays more dividend than 92.86% of the companies in the same industry.
- On average, the dividend of TEL grows each year by 6.41%, which is quite nice.
- TEL has paid a dividend for at least 10 years, which is a reliable track record.
- TEL has not decreased its dividend for at least 10 years, so it has a reliable track record of non decreasing dividend.
- TEL pays out 21.56% of its income as dividend. This is a sustainable payout ratio.
- The dividend of TEL is growing, but earnings are growing more, so the dividend growth is sustainable.
Assessing Health Metrics for NYSE:TEL
ChartMill employs its own Health Rating for stock assessment. This rating, ranging from 0 to 10, is calculated by examining various liquidity and solvency ratios. In the case of NYSE:TEL, the assigned 6 reflects its health status:
- An Altman-Z score of 4.68 indicates that TEL is not in any danger for bankruptcy at the moment.
- TEL has a Altman-Z score of 4.68. This is in the better half of the industry: TEL outperforms 74.60% of its industry peers.
- TEL has a debt to FCF ratio of 1.44. This is a very positive value and a sign of high solvency as it would only need 1.44 years to pay back of all of its debts.
- TEL's Debt to FCF ratio of 1.44 is fine compared to the rest of the industry. TEL outperforms 76.19% of its industry peers.
- A Debt/Equity ratio of 0.23 indicates that TEL is not too dependend on debt financing.
Looking at the Profitability
Discover ChartMill's exclusive Profitability Rating, a proprietary metric that assesses stocks on a scale of 0 to 10. It takes into consideration various profitability ratios and margins, both in absolute terms and relative to industry peers. Notably, NYSE:TEL has achieved a 7:
- The Return On Assets of TEL (15.15%) is better than 96.83% of its industry peers.
- TEL has a Return On Equity of 27.46%. This is amongst the best in the industry. TEL outperforms 95.24% of its industry peers.
- TEL has a better Return On Invested Capital (14.22%) than 90.48% of its industry peers.
- Measured over the past 3 years, the Average Return On Invested Capital for TEL is significantly above the industry average of 9.05%.
- TEL has a Profit Margin of 21.94%. This is amongst the best in the industry. TEL outperforms 96.83% of its industry peers.
- The Operating Margin of TEL (18.51%) is better than 96.83% of its industry peers.
Our Best Dividend screener lists more Best Dividend stocks and is updated daily.
For an up to date full fundamental analysis you can check the fundamental report of TEL
Disclaimer
Important Note: The content of this article is not intended as trading advice. It is essential to perform your own analysis and exercise caution when making trading decisions. The article presents observations created by automated analysis but does not guarantee any trading or investment outcomes. Always trade responsibly and make independent judgments.
144.37
+0.85 (+0.59%)
Find more stocks in the Stock Screener
TEL Latest News and Analysis
 20 days ago - ChartmillIs TE CONNECTIVITY PLC (NYSE:TEL) suited for dividend investing?
Balancing Dividends and Fundamentals: The Case of TE CONNECTIVITY PLC (NYSE:TEL).
